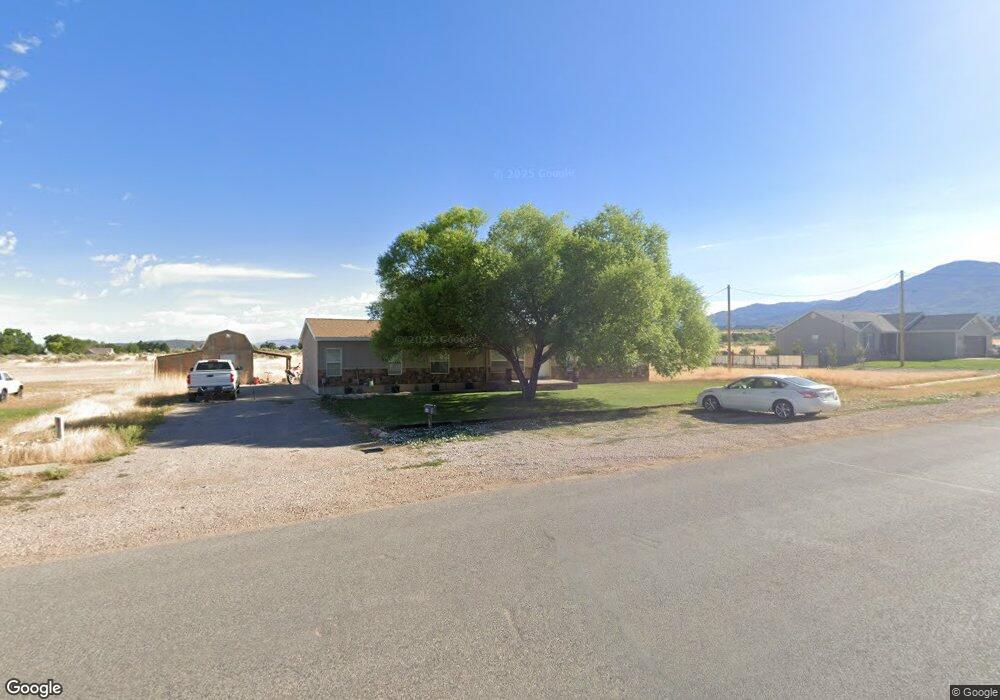
345 E 500 S Fillmore, UT 84631
Estimated Value: $340,000 - $508,000
4
Beds
2
Baths
2,052
Sq Ft
$191/Sq Ft
Est. Value
About This Home
This home is located at 345 E 500 S, Fillmore, UT 84631 and is currently estimated at $392,950, approximately $191 per square foot. 345 E 500 S is a home located in Millard County.
Ownership History
Date
Name
Owned For
Owner Type
Purchase Details
Closed on
Nov 9, 2018
Sold by
Shields Anna E and Shields Rendon D
Bought by
Robison Tiffany
Current Estimated Value
Purchase Details
Closed on
Jun 7, 2018
Sold by
Shields Anna E and Shields Rendon D
Bought by
Shields Anna E and Shields Rendon D
Purchase Details
Closed on
Mar 26, 2009
Sold by
Briceno Jairo A and Briceno Ka Ying
Bought by
Briceno Jairo and Briceno Kaying
Home Financials for this Owner
Home Financials are based on the most recent Mortgage that was taken out on this home.
Original Mortgage
$118,709
Interest Rate
5.06%
Mortgage Type
FHA
Create a Home Valuation Report for This Property
The Home Valuation Report is an in-depth analysis detailing your home's value as well as a comparison with similar homes in the area
Home Values in the Area
Average Home Value in this Area
Purchase History
| Date | Buyer | Sale Price | Title Company |
|---|---|---|---|
| Robison Tiffany | -- | -- | |
| Shields Anna E | -- | First American Title | |
| Shields Anna | -- | -- | |
| Briceno Jairo | -- | -- |
Source: Public Records
Mortgage History
| Date | Status | Borrower | Loan Amount |
|---|---|---|---|
| Previous Owner | Briceno Jairo | $118,709 |
Source: Public Records
Tax History
| Year | Tax Paid | Tax Assessment Tax Assessment Total Assessment is a certain percentage of the fair market value that is determined by local assessors to be the total taxable value of land and additions on the property. | Land | Improvement |
|---|---|---|---|---|
| 2025 | $1,285 | $161,415 | $24,644 | $136,771 |
| 2024 | $1,285 | $137,722 | $16,771 | $120,951 |
| 2023 | $1,416 | $137,722 | $16,771 | $120,951 |
| 2022 | $1,203 | $107,996 | $15,246 | $92,750 |
| 2021 | $1,096 | $94,471 | $12,705 | $81,766 |
| 2020 | $1,013 | $87,825 | $11,550 | $76,275 |
| 2019 | $1,010 | $87,825 | $11,550 | $76,275 |
| 2018 | $815 | $72,570 | $11,550 | $61,020 |
| 2017 | $620 | $52,469 | $11,550 | $40,919 |
| 2016 | $593 | $52,469 | $11,550 | $40,919 |
| 2015 | $593 | $52,469 | $11,550 | $40,919 |
| 2014 | -- | $52,469 | $11,550 | $40,919 |
| 2013 | -- | $52,469 | $11,550 | $40,919 |
Source: Public Records
Map
Nearby Homes
- 405 E 500 St S
- 157 E 500 South St
- 155 E 500 St S
- 430 E Canyon Rd
- 760 E 700 St S
- 235 S 200 St E
- 690 E 500 S
- 465 S 100 W
- 775 E Valley View Rd
- 750 800 South Fillmore
- 825 800 South Fillmore
- 800 800 South Fillmore
- 40 S 100 Rd E
- 260 W 200 S
- 155 W Center St
- 75 N 100 West St
- 351 W 100 South St
- 310 S 500 West Rd
- 225 W 200 St N
- 245 W 300 N
Your Personal Tour Guide
Ask me questions while you tour the home.