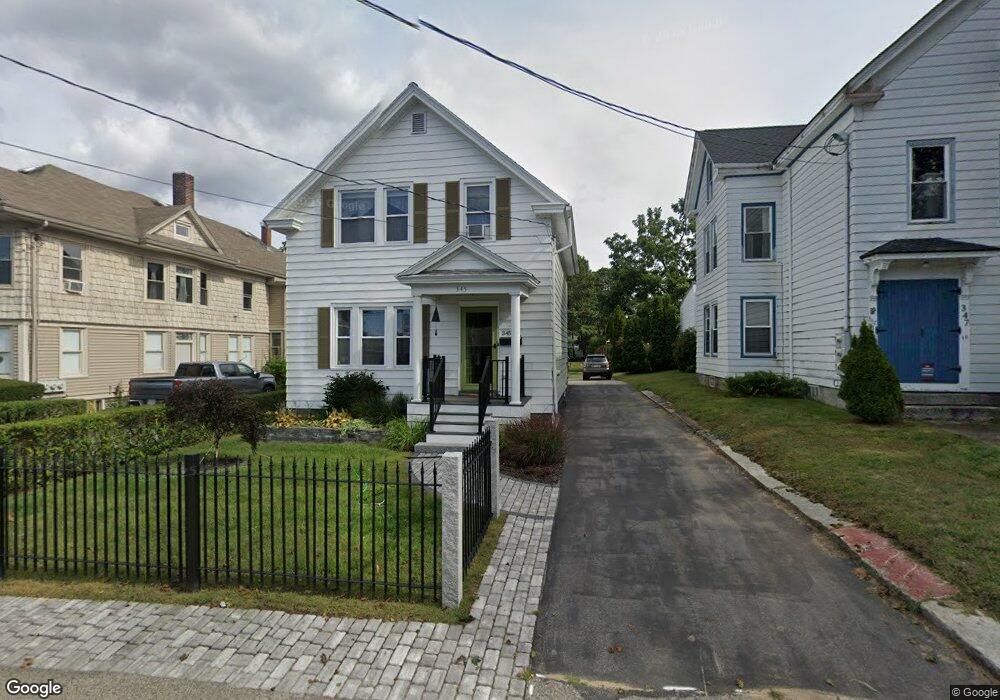
345 Elm St Biddeford, ME 04005
Estimated Value: $344,000 - $418,000
3
Beds
2
Baths
1,188
Sq Ft
$331/Sq Ft
Est. Value
About This Home
This home is located at 345 Elm St, Biddeford, ME 04005 and is currently estimated at $392,718, approximately $330 per square foot. 345 Elm St is a home located in York County with nearby schools including John F Kennedy Memorial School, Biddeford Primary School, and Biddeford Intermediate School.
Ownership History
Date
Name
Owned For
Owner Type
Purchase Details
Closed on
Jul 21, 2005
Sold by
Vigeant Elizabeth A and Vigeant Edgar C
Bought by
Harmon Donna L and Harmon James E
Current Estimated Value
Home Financials for this Owner
Home Financials are based on the most recent Mortgage that was taken out on this home.
Original Mortgage
$155,600
Interest Rate
5.59%
Mortgage Type
Purchase Money Mortgage
Create a Home Valuation Report for This Property
The Home Valuation Report is an in-depth analysis detailing your home's value as well as a comparison with similar homes in the area
Home Values in the Area
Average Home Value in this Area
Purchase History
| Date | Buyer | Sale Price | Title Company |
|---|---|---|---|
| Harmon Donna L | -- | -- | |
| Harmon Donna L | -- | -- | |
| Harmon Donna L | -- | -- |
Source: Public Records
Mortgage History
| Date | Status | Borrower | Loan Amount |
|---|---|---|---|
| Closed | Harmon Donna L | $140,800 | |
| Closed | Harmon Donna L | $155,600 |
Source: Public Records
Tax History Compared to Growth
Tax History
| Year | Tax Paid | Tax Assessment Tax Assessment Total Assessment is a certain percentage of the fair market value that is determined by local assessors to be the total taxable value of land and additions on the property. | Land | Improvement |
|---|---|---|---|---|
| 2024 | $3,396 | $238,800 | $137,000 | $101,800 |
| 2023 | $3,133 | $238,800 | $137,000 | $101,800 |
| 2022 | $2,973 | $181,200 | $74,600 | $106,600 |
| 2021 | $2,791 | $153,100 | $62,200 | $90,900 |
| 2020 | $2,632 | $137,300 | $52,900 | $84,400 |
| 2019 | $2,703 | $135,300 | $52,900 | $82,400 |
| 2018 | $2,665 | $135,300 | $52,900 | $82,400 |
| 2017 | $2,551 | $129,000 | $52,900 | $76,100 |
| 2016 | $2,562 | $129,000 | $52,900 | $76,100 |
| 2015 | $2,512 | $129,000 | $52,900 | $76,100 |
| 2014 | $2,450 | $129,000 | $52,900 | $76,100 |
| 2013 | -- | $148,900 | $59,200 | $89,700 |
Source: Public Records
Map
Nearby Homes