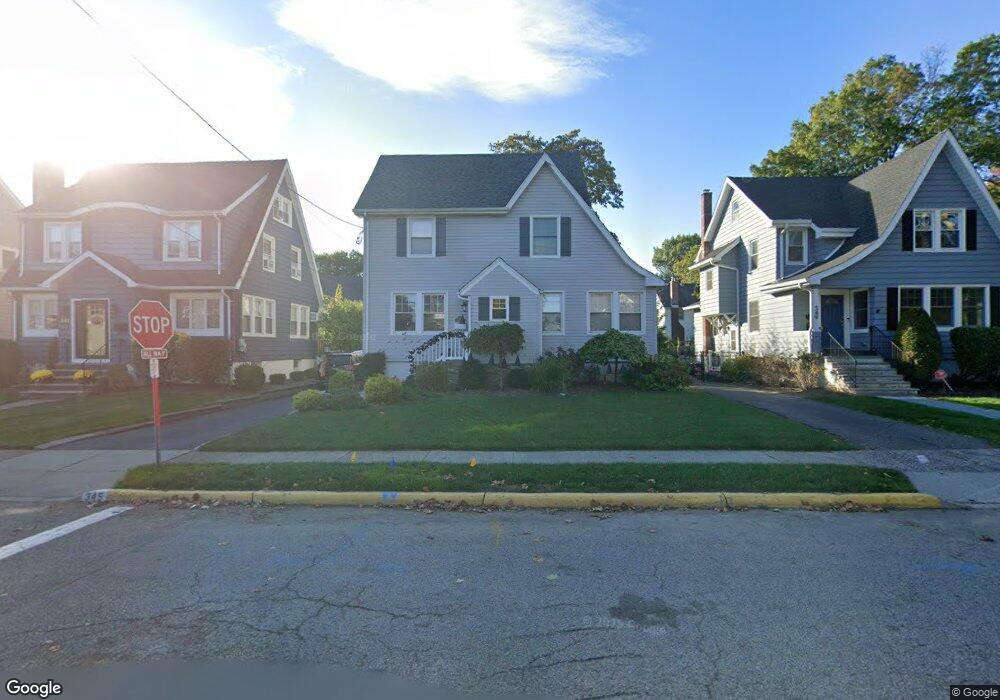
345 Elm St Oradell, NJ 07649
Estimated Value: $668,000 - $832,000
4
Beds
1
Bath
1,416
Sq Ft
$535/Sq Ft
Est. Value
About This Home
This home is located at 345 Elm St, Oradell, NJ 07649 and is currently estimated at $757,626, approximately $535 per square foot. 345 Elm St is a home located in Bergen County with nearby schools including Oradell Elementary School, River Dell Middle School, and River Dell Regional High School.
Ownership History
Date
Name
Owned For
Owner Type
Purchase Details
Closed on
Oct 16, 1997
Sold by
Wutzdorff Allen John and Wutzdorff Oscar
Bought by
Morch Scott S and Morch Susan W
Current Estimated Value
Home Financials for this Owner
Home Financials are based on the most recent Mortgage that was taken out on this home.
Original Mortgage
$182,850
Outstanding Balance
$29,403
Interest Rate
7.46%
Estimated Equity
$728,223
Create a Home Valuation Report for This Property
The Home Valuation Report is an in-depth analysis detailing your home's value as well as a comparison with similar homes in the area
Home Values in the Area
Average Home Value in this Area
Purchase History
| Date | Buyer | Sale Price | Title Company |
|---|---|---|---|
| Morch Scott S | $192,500 | -- |
Source: Public Records
Mortgage History
| Date | Status | Borrower | Loan Amount |
|---|---|---|---|
| Open | Morch Scott S | $182,850 |
Source: Public Records
Tax History Compared to Growth
Tax History
| Year | Tax Paid | Tax Assessment Tax Assessment Total Assessment is a certain percentage of the fair market value that is determined by local assessors to be the total taxable value of land and additions on the property. | Land | Improvement |
|---|---|---|---|---|
| 2025 | $13,430 | $555,500 | $282,000 | $273,500 |
| 2024 | $13,103 | $493,400 | $250,400 | $243,000 |
| 2023 | $12,533 | $491,100 | $249,400 | $241,700 |
| 2022 | $12,533 | $468,700 | $239,400 | $229,300 |
| 2021 | $12,202 | $436,400 | $216,800 | $219,600 |
| 2020 | $10,447 | $378,100 | $200,800 | $177,300 |
| 2019 | $10,356 | $371,700 | $197,800 | $173,900 |
| 2018 | $9,923 | $361,500 | $189,800 | $171,700 |
| 2017 | $9,595 | $355,100 | $186,800 | $168,300 |
| 2016 | $9,187 | $308,700 | $176,500 | $132,200 |
| 2015 | $8,986 | $308,700 | $176,500 | $132,200 |
| 2014 | $8,594 | $308,700 | $176,500 | $132,200 |
Source: Public Records
Map
Nearby Homes
- 171 Harrison St
- 147 Pine Ave
- 69 River Rd
- 207 Grand St
- 243 Main St
- 264 Demarest Ave
- 680 Soldier Hill Rd
- 274 Milford Ave
- 211 Madison Ave
- 812 Ridgewood Ave
- 784 Austin Ave
- 787 Schaefer Ave
- 314 Hirschfeld Place
- 507 James St
- 87 Surrey Ln
- 377 New Milford Ave
- 72 Ontario St
- 627 Concord St
- 227 Cedar Rd
- 277 Columbia Terrace