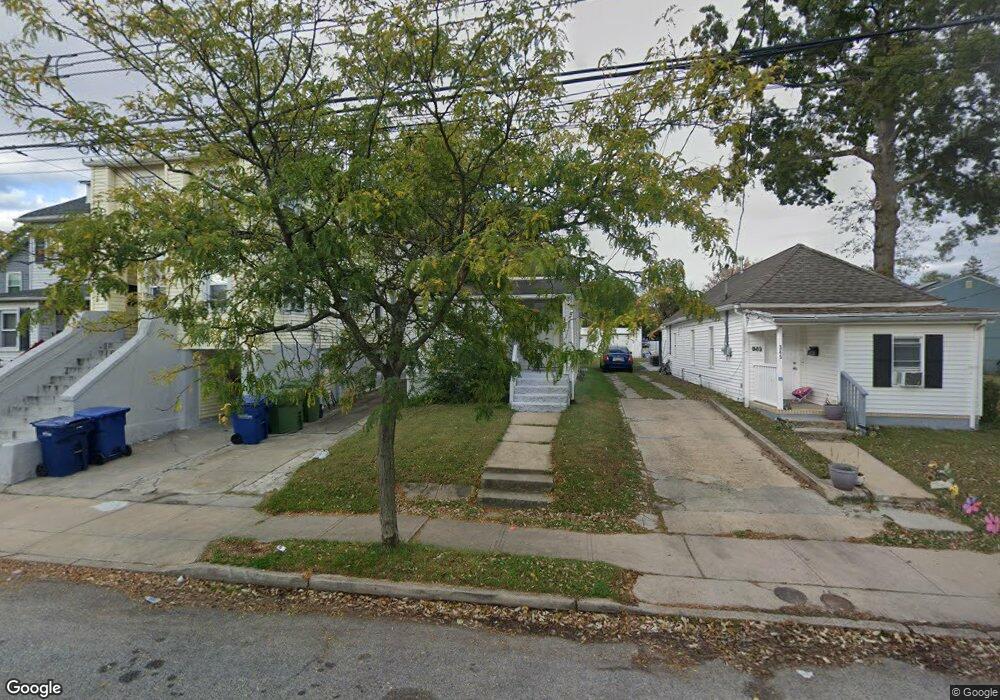
345 Fisher Ave Neptune, NJ 07753
Estimated Value: $384,000 - $467,000
2
Beds
1
Bath
732
Sq Ft
$581/Sq Ft
Est. Value
About This Home
This home is located at 345 Fisher Ave, Neptune, NJ 07753 and is currently estimated at $425,018, approximately $580 per square foot. 345 Fisher Ave is a home located in Monmouth County with nearby schools including Neptune High School and Our Lady of Mount Carmel School.
Ownership History
Date
Name
Owned For
Owner Type
Purchase Details
Closed on
Dec 28, 2021
Sold by
Robert Klimowicz
Bought by
Nico Housing Llc
Current Estimated Value
Home Financials for this Owner
Home Financials are based on the most recent Mortgage that was taken out on this home.
Original Mortgage
$252,960
Outstanding Balance
$234,473
Interest Rate
3.56%
Mortgage Type
New Conventional
Estimated Equity
$190,545
Purchase Details
Closed on
Jul 29, 2010
Sold by
Deutsche Bank National Trust Company
Bought by
Klimowicz Robert S
Purchase Details
Closed on
Apr 4, 2008
Sold by
Cpw Trading Llc
Bought by
Clark Walter M
Purchase Details
Closed on
Jun 27, 2006
Sold by
Brackett Norman
Bought by
Clark Walter M
Home Financials for this Owner
Home Financials are based on the most recent Mortgage that was taken out on this home.
Original Mortgage
$235,000
Interest Rate
9.5%
Mortgage Type
Adjustable Rate Mortgage/ARM
Create a Home Valuation Report for This Property
The Home Valuation Report is an in-depth analysis detailing your home's value as well as a comparison with similar homes in the area
Home Values in the Area
Average Home Value in this Area
Purchase History
| Date | Buyer | Sale Price | Title Company |
|---|---|---|---|
| Nico Housing Llc | $316,200 | Old Republic Title | |
| Klimowicz Robert S | $58,500 | Fidelity Natl Title Ins Co | |
| Clark Walter M | -- | None Available | |
| Clark Walter M | $235,000 | -- |
Source: Public Records
Mortgage History
| Date | Status | Borrower | Loan Amount |
|---|---|---|---|
| Open | Nico Housing Llc | $252,960 | |
| Previous Owner | Clark Walter M | $235,000 |
Source: Public Records
Tax History Compared to Growth
Tax History
| Year | Tax Paid | Tax Assessment Tax Assessment Total Assessment is a certain percentage of the fair market value that is determined by local assessors to be the total taxable value of land and additions on the property. | Land | Improvement |
|---|---|---|---|---|
| 2025 | $6,671 | $415,100 | $202,000 | $213,100 |
| 2024 | $6,027 | $381,000 | $171,800 | $209,200 |
| 2023 | $6,027 | $333,700 | $129,300 | $204,400 |
| 2022 | $4,982 | $299,400 | $84,800 | $214,600 |
| 2021 | $4,982 | $235,800 | $70,800 | $165,000 |
| 2020 | $4,454 | $210,300 | $53,900 | $156,400 |
| 2019 | $4,307 | $200,800 | $53,200 | $147,600 |
| 2018 | $4,333 | $199,700 | $53,200 | $146,500 |
| 2017 | $4,265 | $188,800 | $53,200 | $135,600 |
| 2016 | $4,226 | $186,600 | $53,200 | $133,400 |
| 2015 | $4,084 | $183,400 | $53,200 | $130,200 |
| 2014 | $3,849 | $142,100 | $42,400 | $99,700 |
Source: Public Records
Map
Nearby Homes
- 1711 Stratford Ave
- 1807 Milton Ave
- 264 Fisher Ave
- 1604 Bangs Ave
- 141 Elizabeth Ave
- 1704 Summerfield Ave
- 1702 Summerfield Ave
- 0 Bangs Ave
- 230 Fisher Ave
- 5 Ivy Place
- 401 Ridge Ave
- 135-137 Dewitt Ave
- 1902 Stratford Ave
- 1405 Mattison Ave
- 128 Dewitt Ave
- 126 Dewitt Ave
- 200 Drummond Ave
- 1601 Heck Ave
- 1961 W Lake Ave
- 1608 Heck Ave
- 337 Fisher Ave
- 337 Fisher Ave Unit LLC
- 351 Fisher Ave
- 335 Fisher Ave
- 1706 Stratford Ave
- 331 Fisher Ave
- 1708 Stratford Ave
- 329 Fisher Ave
- 350 Drummond Ave
- 348 Drummond Ave
- 352 Drummond Ave
- 1710 Stratford Ave
- 346 Drummond Ave
- 340 Fisher Ave
- 336 Fisher Ave
- 350 Fisher Ave
- 1703 Stratford Ave
- 327 Fisher Ave
- 1705 Stratford Ave
- 1701 Stratford Ave