Estimated Value: $189,000 - $226,000
3
Beds
2
Baths
1,377
Sq Ft
$153/Sq Ft
Est. Value
About This Home
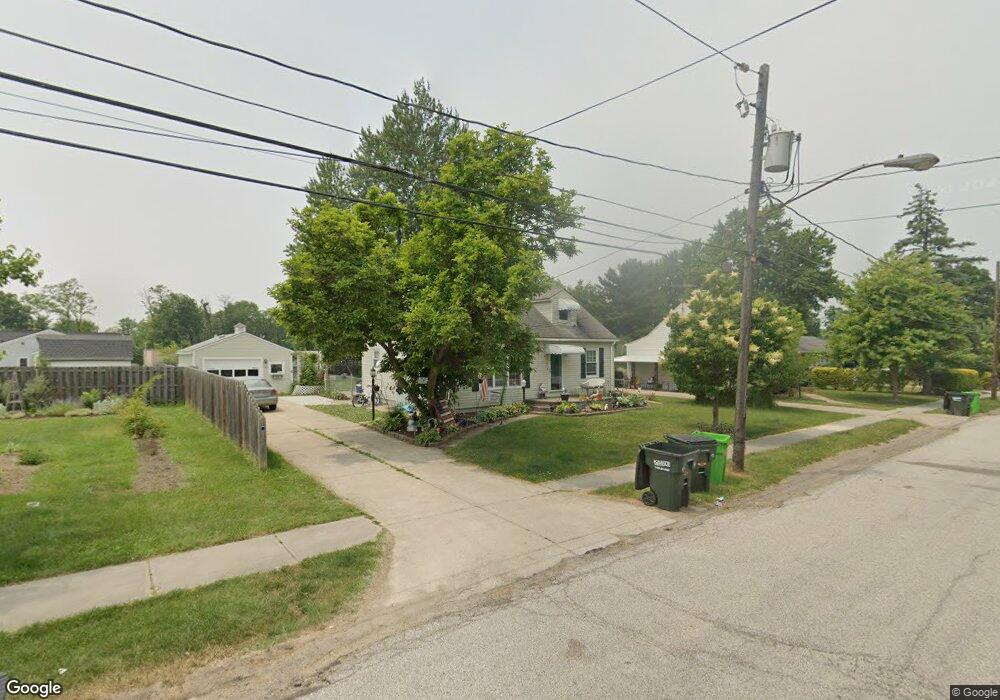
This home is located at 345 High St, Berea, OH 44017 and is currently estimated at $210,429, approximately $152 per square foot. 345 High St is a home located in Cuyahoga County with nearby schools including Grindstone Elementary School, Berea-Midpark Middle School, and Berea-Midpark High School.
Ownership History
Date
Name
Owned For
Owner Type
Purchase Details
Closed on
Dec 23, 2010
Sold by
Cendrowski Joseph E
Bought by
Cendrowski Sandra
Current Estimated Value
Purchase Details
Closed on
Dec 8, 2003
Sold by
Kalus Diane
Bought by
Cendrowski Joseph E
Home Financials for this Owner
Home Financials are based on the most recent Mortgage that was taken out on this home.
Original Mortgage
$90,800
Outstanding Balance
$42,457
Interest Rate
6.01%
Mortgage Type
Purchase Money Mortgage
Estimated Equity
$167,972
Purchase Details
Closed on
Nov 15, 1993
Sold by
Wilczek Stanley and Wilczek Adeline
Bought by
Wilczek Adeline
Purchase Details
Closed on
May 30, 1979
Sold by
Wilczek Adeline and Wilczek Stanley
Bought by
Wilczek Stanley and Wilczek Adeline
Purchase Details
Closed on
Jan 1, 1975
Bought by
Wilczek Adeline and Wilczek Stanley
Create a Home Valuation Report for This Property
The Home Valuation Report is an in-depth analysis detailing your home's value as well as a comparison with similar homes in the area
Home Values in the Area
Average Home Value in this Area
Purchase History
| Date | Buyer | Sale Price | Title Company |
|---|---|---|---|
| Cendrowski Sandra | -- | Attorney | |
| Cendrowski Joseph E | $113,500 | -- | |
| Wilczek Adeline | -- | -- | |
| Wilczek Stanley | -- | -- | |
| Wilczek Adeline | -- | -- |
Source: Public Records
Mortgage History
| Date | Status | Borrower | Loan Amount |
|---|---|---|---|
| Open | Cendrowski Joseph E | $90,800 |
Source: Public Records
Tax History
| Year | Tax Paid | Tax Assessment Tax Assessment Total Assessment is a certain percentage of the fair market value that is determined by local assessors to be the total taxable value of land and additions on the property. | Land | Improvement |
|---|---|---|---|---|
| 2024 | $3,023 | $61,740 | $14,630 | $47,110 |
| 2023 | $2,910 | $51,100 | $14,945 | $36,155 |
| 2022 | $2,920 | $51,100 | $14,945 | $36,155 |
| 2021 | $4,972 | $51,100 | $14,950 | $36,160 |
| 2020 | $5,205 | $43,300 | $12,670 | $30,630 |
| 2019 | $3,233 | $123,700 | $36,200 | $87,500 |
| 2018 | $3,209 | $43,300 | $12,670 | $30,630 |
| 2017 | $2,840 | $35,490 | $8,610 | $26,880 |
| 2016 | $2,818 | $35,490 | $8,610 | $26,880 |
| 2015 | $2,774 | $35,490 | $8,610 | $26,880 |
| 2014 | $2,774 | $36,960 | $8,960 | $28,000 |
Source: Public Records
Map
Nearby Homes
- 93 W 5th Ave
- 487 Karen Dr
- 146 Marian Ln
- 211 W Bridge St
- 160 Marian Ln Unit 6A
- 209 Gibson St
- 56 3rd Ave
- 57 Riverside Dr
- 404 Crescent Dr
- 725 Shakespeare Dr
- 428 Park Place
- 379 Laurel Dr
- 300 West St
- 287 Edgewood Dr
- 0 E Bagley Rd Unit 5111166
- 388 Fairwood Cir
- 446 Redwood Dr
- 347 Beeler Dr
- 49 Monroe St
- 6574 Burton Dr
Your Personal Tour Guide
Ask me questions while you tour the home.