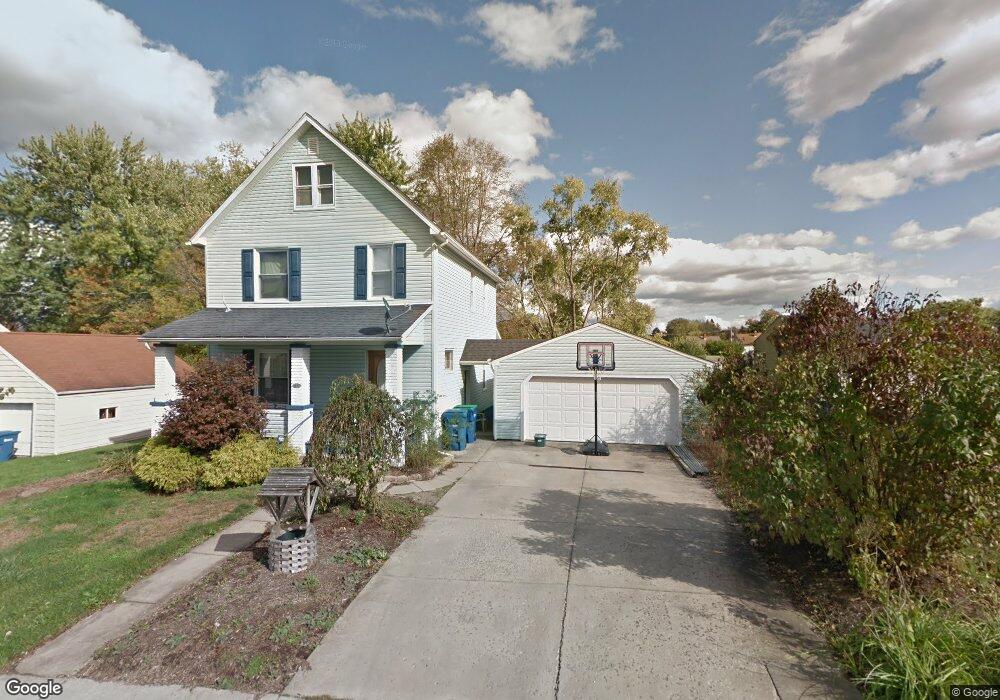
345 Jackson St Hubbard, OH 44425
Estimated Value: $152,000 - $173,000
4
Beds
2
Baths
1,552
Sq Ft
$102/Sq Ft
Est. Value
About This Home
This home is located at 345 Jackson St, Hubbard, OH 44425 and is currently estimated at $159,052, approximately $102 per square foot. 345 Jackson St is a home located in Trumbull County with nearby schools including Hubbard Elementary School, Hubbard Middle School, and Hubbard High School.
Ownership History
Date
Name
Owned For
Owner Type
Purchase Details
Closed on
May 11, 2006
Sold by
Gonder David and Gonder Cathy
Bought by
Livingston Anthony E and Seese Amanda S
Current Estimated Value
Home Financials for this Owner
Home Financials are based on the most recent Mortgage that was taken out on this home.
Original Mortgage
$83,230
Outstanding Balance
$47,113
Interest Rate
6.39%
Mortgage Type
FHA
Estimated Equity
$111,939
Purchase Details
Closed on
Apr 4, 2006
Sold by
Gonder David and Gonder Cathy
Bought by
Livingston Anthony E and Seese Amanda S
Home Financials for this Owner
Home Financials are based on the most recent Mortgage that was taken out on this home.
Original Mortgage
$83,230
Outstanding Balance
$47,113
Interest Rate
6.39%
Mortgage Type
FHA
Estimated Equity
$111,939
Purchase Details
Closed on
Jan 1, 1990
Bought by
David Gonder T and David E
Create a Home Valuation Report for This Property
The Home Valuation Report is an in-depth analysis detailing your home's value as well as a comparison with similar homes in the area
Home Values in the Area
Average Home Value in this Area
Purchase History
| Date | Buyer | Sale Price | Title Company |
|---|---|---|---|
| Livingston Anthony E | $86,275 | None Available | |
| Livingston Anthony E | $86,275 | None Available | |
| David Gonder T | -- | -- |
Source: Public Records
Mortgage History
| Date | Status | Borrower | Loan Amount |
|---|---|---|---|
| Open | Livingston Anthony E | $83,230 | |
| Closed | Livingston Anthony E | $83,230 |
Source: Public Records
Tax History
| Year | Tax Paid | Tax Assessment Tax Assessment Total Assessment is a certain percentage of the fair market value that is determined by local assessors to be the total taxable value of land and additions on the property. | Land | Improvement |
|---|---|---|---|---|
| 2024 | $1,954 | $39,310 | $6,160 | $33,150 |
| 2023 | $1,919 | $39,310 | $6,160 | $33,150 |
| 2022 | $1,410 | $26,330 | $5,640 | $20,690 |
| 2021 | $1,417 | $26,330 | $5,640 | $20,690 |
| 2020 | $1,423 | $26,330 | $5,640 | $20,690 |
| 2019 | $1,388 | $24,610 | $5,640 | $18,970 |
| 2018 | $1,383 | $24,610 | $5,640 | $18,970 |
| 2017 | $1,379 | $24,610 | $5,640 | $18,970 |
| 2016 | $1,197 | $22,720 | $5,640 | $17,080 |
| 2015 | $1,202 | $22,720 | $5,640 | $17,080 |
| 2014 | $1,175 | $22,720 | $5,640 | $17,080 |
| 2013 | $1,172 | $22,720 | $5,640 | $17,080 |
Source: Public Records
Map
Nearby Homes
- 228 Center St
- 323 W Liberty St
- 330 Myron St Unit 3
- 203 Hager St
- 135 Clingan St
- 365 Scott St
- 911 Dogwood Dr SE
- 57 Belle Vista Ave
- 239 Princeton Ave
- 1029 N Main St
- 396 Elizabeth St
- 132 Drummond Ave
- 62 Jacobs Rd
- 805 Johnny K Blvd
- 784 Elmwood Dr
- 601 Wendemere Dr
- 585 Creekside Dr
- 3516 Roseview Dr
- 868 Saul Dr
- 3267 Bell Wick Rd
Your Personal Tour Guide
Ask me questions while you tour the home.