Estimated Value: $239,302 - $286,000
3
Beds
2
Baths
1,464
Sq Ft
$180/Sq Ft
Est. Value
About This Home
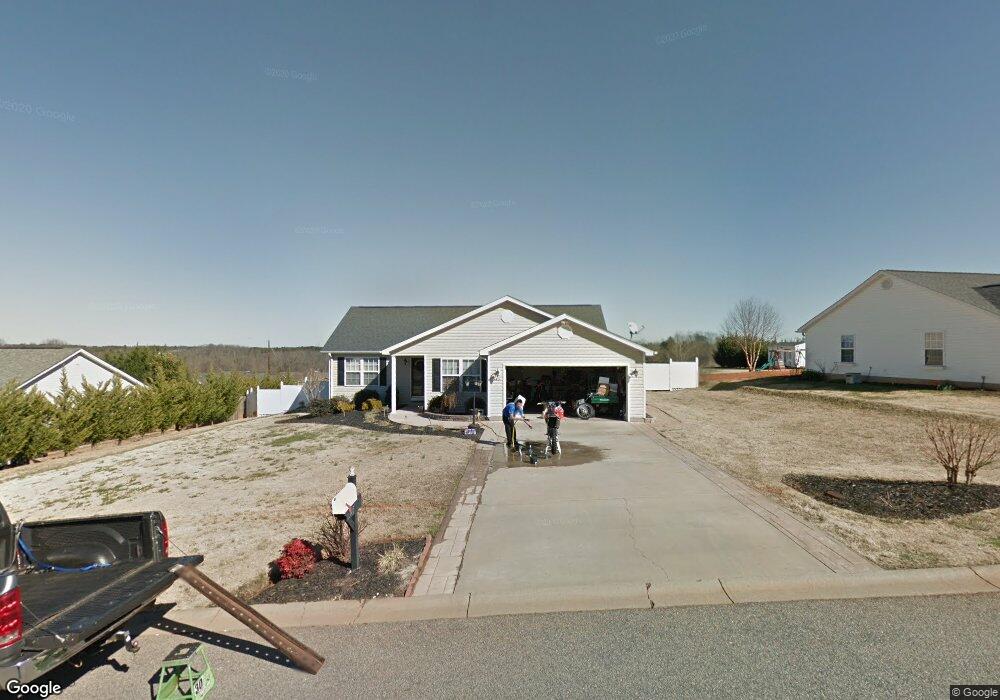
This home is located at 345 James Allgood Dr, Inman, SC 29349 and is currently estimated at $263,076, approximately $179 per square foot. 345 James Allgood Dr is a home located in Spartanburg County with nearby schools including Dorman High School Freshman Campus, Dorman High School, and Inman Christian Academy.
Ownership History
Date
Name
Owned For
Owner Type
Purchase Details
Closed on
Aug 26, 2016
Sold by
Burns Joseph Nicholas
Bought by
Reeise Seth Keenan
Current Estimated Value
Purchase Details
Closed on
Aug 25, 2016
Sold by
Robbins Lori Jane and Burns Lori Jane Robbins
Bought by
Burns Joseph Nicolas
Purchase Details
Closed on
Oct 15, 2008
Sold by
Busko Vasiliy and Busko Tatyana
Bought by
Burns Joseph Nicholas and Robbins Lori Jane
Home Financials for this Owner
Home Financials are based on the most recent Mortgage that was taken out on this home.
Original Mortgage
$130,050
Interest Rate
6.34%
Mortgage Type
Purchase Money Mortgage
Purchase Details
Closed on
Aug 14, 2003
Sold by
Mickelson Ted
Bought by
Busko Vasiliy and Busko Tatyana
Purchase Details
Closed on
Mar 5, 2003
Sold by
Allgood Estates Inc
Bought by
Mickelson Ted
Create a Home Valuation Report for This Property
The Home Valuation Report is an in-depth analysis detailing your home's value as well as a comparison with similar homes in the area
Home Values in the Area
Average Home Value in this Area
Purchase History
| Date | Buyer | Sale Price | Title Company |
|---|---|---|---|
| Reeise Seth Keenan | $141,000 | Attorney | |
| Burns Joseph Nicolas | -- | Attorney | |
| Burns Joseph Nicholas | $127,500 | -- | |
| Busko Vasiliy | $112,000 | -- | |
| Mickelson Ted | $15,000 | -- |
Source: Public Records
Mortgage History
| Date | Status | Borrower | Loan Amount |
|---|---|---|---|
| Previous Owner | Burns Joseph Nicholas | $130,050 |
Source: Public Records
Tax History Compared to Growth
Tax History
| Year | Tax Paid | Tax Assessment Tax Assessment Total Assessment is a certain percentage of the fair market value that is determined by local assessors to be the total taxable value of land and additions on the property. | Land | Improvement |
|---|---|---|---|---|
| 2025 | $3,622 | $10,350 | $1,584 | $8,766 |
| 2024 | $3,622 | $10,350 | $1,584 | $8,766 |
| 2023 | $3,622 | $6,900 | $1,056 | $5,844 |
| 2022 | $1,064 | $6,000 | $1,000 | $5,000 |
| 2021 | $1,064 | $6,000 | $1,000 | $5,000 |
| 2020 | $1,045 | $6,000 | $1,000 | $5,000 |
| 2019 | $1,045 | $6,000 | $1,000 | $5,000 |
| 2018 | $1,045 | $6,000 | $1,000 | $5,000 |
| 2017 | $971 | $5,640 | $1,000 | $4,640 |
| 2016 | $864 | $4,984 | $1,000 | $3,984 |
| 2015 | $859 | $4,984 | $1,000 | $3,984 |
| 2014 | $830 | $4,984 | $1,000 | $3,984 |
Source: Public Records
Map
Nearby Homes
- 422 Mount Hood Dr
- 315 E Story Bush Ln
- 138 Glassy Dr
- 433 Pleasant Green Dr
- 329 Steelman Dr
- 3981 New Cut Rd
- 0 Bobo Dr
- 141 Old Settle Rd
- 4156 New Cut Rd
- 3652 New Cut Rd
- 361 Split Oak Ln
- 4210 New Cut Rd
- 1513 Settle Rd
- 1 Dallas St
- 274 Wedgewood
- 278 Wedgewood
- 290 Wedgewood Rd
- 834 John Weaver Trace
- 388-390 Miller Point Dr
- 814 Hickory Hollow Rd
- 349 James Allgood Dr
- 341 James Allgood Dr
- 344 James Allgood Dr
- 348 James Allgood Dr
- 353 James Allgood Dr
- 337 James Allgood Dr
- 340 James Allgood Dr
- 352 James Allgood Dr
- 258 Ranier Dr
- 262 Ranier Dr
- 250 Ranier Dr
- 336 James Allgood Dr
- 246 Ranier Dr
- 357 James Allgood Dr
- 333 James Allgood Dr
- 244 Ranier Dr
- 268 Ranier Dr
- 731 Evelyn Mae Rd
- 356 James Allgood Dr
- 401 Mount Hood Dr