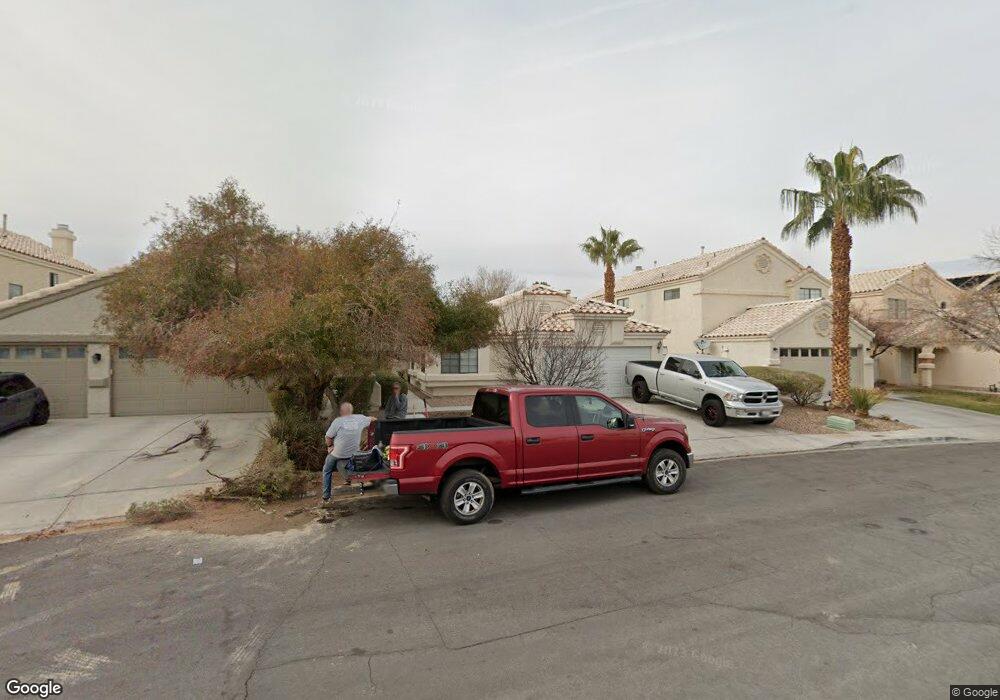
345 Lander Dr Henderson, NV 89074
Green Valley North NeighborhoodEstimated Value: $400,000 - $436,000
3
Beds
2
Baths
1,493
Sq Ft
$282/Sq Ft
Est. Value
About This Home
This home is located at 345 Lander Dr, Henderson, NV 89074 and is currently estimated at $420,683, approximately $281 per square foot. 345 Lander Dr is a home located in Clark County with nearby schools including David M Cox Elementary School, Barbara and Hank Greenspun Junior High School, and Silverado High School.
Ownership History
Date
Name
Owned For
Owner Type
Purchase Details
Closed on
Sep 30, 2019
Sold by
Sharp Mary Carol and Chun Clarence K C
Bought by
Sharp Mary Carol and Chun Clarence K C
Current Estimated Value
Purchase Details
Closed on
Dec 30, 2003
Sold by
Chun Clarence K C
Bought by
Sharp Mary Carol and Chun Clarence K C
Home Financials for this Owner
Home Financials are based on the most recent Mortgage that was taken out on this home.
Original Mortgage
$144,750
Outstanding Balance
$67,271
Interest Rate
5.81%
Mortgage Type
Unknown
Estimated Equity
$353,412
Purchase Details
Closed on
Jan 10, 1995
Sold by
Ebesu Vicki Y
Bought by
Chun Clarence K C
Home Financials for this Owner
Home Financials are based on the most recent Mortgage that was taken out on this home.
Original Mortgage
$77,000
Interest Rate
9.27%
Purchase Details
Closed on
Dec 9, 1994
Sold by
Goode Paul
Bought by
Cabatingan Albert Alcazar
Home Financials for this Owner
Home Financials are based on the most recent Mortgage that was taken out on this home.
Original Mortgage
$77,000
Interest Rate
9.27%
Purchase Details
Closed on
Dec 7, 1994
Sold by
Cabatingan Albert Alcazar
Bought by
Ebesu Vicki Y
Home Financials for this Owner
Home Financials are based on the most recent Mortgage that was taken out on this home.
Original Mortgage
$77,000
Interest Rate
9.27%
Create a Home Valuation Report for This Property
The Home Valuation Report is an in-depth analysis detailing your home's value as well as a comparison with similar homes in the area
Home Values in the Area
Average Home Value in this Area
Purchase History
| Date | Buyer | Sale Price | Title Company |
|---|---|---|---|
| Sharp Mary Carol | -- | None Available | |
| Sharp Mary Carol | $141,310 | Ticor Title Of Nevada Inc | |
| Chun Clarence K C | $110,000 | Stewart Title | |
| Cabatingan Albert Alcazar | -- | -- | |
| Ebesu Vicki Y | -- | -- |
Source: Public Records
Mortgage History
| Date | Status | Borrower | Loan Amount |
|---|---|---|---|
| Open | Sharp Mary Carol | $144,750 | |
| Closed | Chun Clarence K C | $77,000 |
Source: Public Records
Tax History Compared to Growth
Tax History
| Year | Tax Paid | Tax Assessment Tax Assessment Total Assessment is a certain percentage of the fair market value that is determined by local assessors to be the total taxable value of land and additions on the property. | Land | Improvement |
|---|---|---|---|---|
| 2025 | $1,951 | $86,551 | $37,100 | $49,451 |
| 2024 | $1,807 | $86,551 | $37,100 | $49,451 |
| 2023 | $1,203 | $78,501 | $31,150 | $47,351 |
| 2022 | $1,674 | $73,037 | $29,330 | $43,707 |
| 2021 | $1,550 | $68,011 | $26,250 | $41,761 |
| 2020 | $1,436 | $67,602 | $25,900 | $41,702 |
| 2019 | $1,346 | $62,398 | $21,000 | $41,398 |
| 2018 | $1,284 | $59,681 | $19,600 | $40,081 |
| 2017 | $1,753 | $60,478 | $19,600 | $40,878 |
| 2016 | $1,203 | $53,417 | $12,250 | $41,167 |
| 2015 | $1,200 | $47,747 | $9,800 | $37,947 |
| 2014 | $1,163 | $38,940 | $8,750 | $30,190 |
Source: Public Records
Map
Nearby Homes
- 353 Lander Terrace
- 367 Lander Dr
- 2657 Storey Cir
- 314 Lander Dr
- 2786 Fountain Ridge Ln
- 3120 E Eldorado Ln
- 2792 Fountain Ridge Ln
- 2766 Red Vista Ct
- 2648 White Pine Dr
- 2775 Red Vista Ct
- 2926 E Eldorado Ln
- 364 Clark Dr
- 7492 Midfield Ct
- 3221 Montecito Dr
- 7258 Loma Alta Cir
- 313 Birmingham St
- 2838 Via Stella St
- 259 Bonnie Claire Ct
- 2816 Via Florentine St
- 2606 Heartland Ave