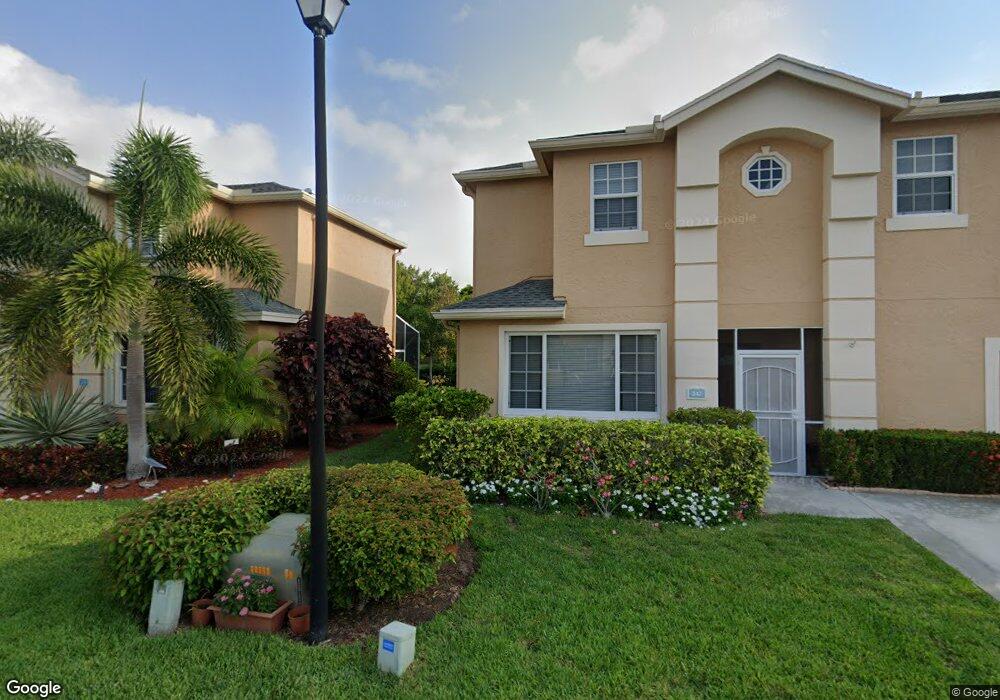
345 Laurel Oaks Way Jupiter, FL 33458
Jupiter Park NeighborhoodEstimated Value: $380,000 - $450,000
2
Beds
3
Baths
1,475
Sq Ft
$283/Sq Ft
Est. Value
About This Home
This home is located at 345 Laurel Oaks Way, Jupiter, FL 33458 and is currently estimated at $417,895, approximately $283 per square foot. 345 Laurel Oaks Way is a home located in Palm Beach County with nearby schools including Jerry Thomas Elementary School, Independence Middle School, and Jupiter High School.
Ownership History
Date
Name
Owned For
Owner Type
Purchase Details
Closed on
Mar 28, 2006
Sold by
Collazzo Charles J and Snell Jane
Bought by
Collazzo Charles J and Snell Jane
Current Estimated Value
Purchase Details
Closed on
Aug 17, 2005
Sold by
Snell Jane
Bought by
Snell Jane and Collazzo Charles J
Purchase Details
Closed on
Sep 16, 2002
Sold by
Schwartz Jane Snell
Bought by
Snell Jane
Home Financials for this Owner
Home Financials are based on the most recent Mortgage that was taken out on this home.
Original Mortgage
$67,700
Outstanding Balance
$27,638
Interest Rate
6.19%
Estimated Equity
$390,257
Purchase Details
Closed on
Oct 8, 1999
Sold by
Laurel Crown Assoc Inc
Bought by
Schwartz Jane S
Home Financials for this Owner
Home Financials are based on the most recent Mortgage that was taken out on this home.
Original Mortgage
$72,000
Interest Rate
7.79%
Mortgage Type
New Conventional
Purchase Details
Closed on
Jul 10, 1998
Sold by
Moskowitz Real Properties Corp
Bought by
Laurel Crown Assoc Inc
Create a Home Valuation Report for This Property
The Home Valuation Report is an in-depth analysis detailing your home's value as well as a comparison with similar homes in the area
Home Values in the Area
Average Home Value in this Area
Purchase History
| Date | Buyer | Sale Price | Title Company |
|---|---|---|---|
| Collazzo Charles J | -- | None Available | |
| Collazzo Charles J | -- | None Available | |
| Snell Jane | -- | -- | |
| Snell Jane | -- | -- | |
| Schwartz Jane S | $112,000 | -- | |
| Laurel Crown Assoc Inc | $160,000 | -- |
Source: Public Records
Mortgage History
| Date | Status | Borrower | Loan Amount |
|---|---|---|---|
| Open | Snell Jane | $67,700 | |
| Closed | Laurel Crown Assoc Inc | $72,000 |
Source: Public Records
Tax History
| Year | Tax Paid | Tax Assessment Tax Assessment Total Assessment is a certain percentage of the fair market value that is determined by local assessors to be the total taxable value of land and additions on the property. | Land | Improvement |
|---|---|---|---|---|
| 2025 | $1,827 | $145,933 | -- | -- |
| 2024 | $1,827 | $141,820 | -- | -- |
| 2023 | $1,785 | $137,689 | $0 | $0 |
| 2022 | $1,765 | $133,679 | $0 | $0 |
| 2021 | $1,738 | $129,785 | $0 | $0 |
| 2020 | $1,730 | $127,993 | $0 | $0 |
| 2019 | $1,658 | $122,821 | $0 | $0 |
| 2018 | $1,562 | $120,531 | $0 | $0 |
| 2017 | $1,549 | $118,052 | $0 | $0 |
| 2016 | $1,543 | $115,624 | $0 | $0 |
| 2015 | $1,580 | $114,820 | $0 | $0 |
| 2014 | $1,596 | $113,909 | $0 | $0 |
Source: Public Records
Map
Nearby Homes
- 6258 Chasewood Dr Unit C
- 6495 Chasewood Dr Unit B
- 6495 Chasewood Dr Unit C
- 6495 Chasewood Dr Unit E
- 166 Timberwalk Trail
- 170 Timberwalk Trail
- 174 Timberwalk Trail
- 6286 Chasewood Dr Unit E
- 145 Timberwalk Trail
- 314 Timberwalk Trail
- 106 Wooden Mill Terrace
- 6500 Chasewood Dr Unit A
- 6341 Chasewood Dr Unit D
- 6447 Chasewood Dr Unit C
- 301 Lakewood Dr Unit 8A
- 6544 Chasewood Dr Unit H
- 6512 Chasewood Dr Unit H
- 6536 Chasewood Dr Unit A
- 6536 Chasewood Dr Unit H
- 162 Greentree Cir
- 347 Laurel Oaks Way
- 343 Laurel Oaks Way
- 346 Laurel Oaks Way
- 348 Laurel Oaks Way
- 349 Laurel Oaks Way
- 344 Laurel Oaks Way
- 350 Laurel Oaks Way
- 340 Laurel Oaks Way
- 338 Laurel Oaks Way
- 331 Oak Crest Terrace
- 329 Oak Crest Terrace
- 0 Laurel Oaks Way Unit 305
- 336 Laurel Oaks Way
- 334 Laurel Oaks Way
- 330 Oak Crest Terrace
- 332 Laurel Oaks Way
- 328 Oak Crest Terrace
- 108 Owl Pointe Cir
- 279 Live Oaks Ln
- 279 Live Oaks Ln Unit 279
Your Personal Tour Guide
Ask me questions while you tour the home.