345 Malacca St Akron, OH 44305
Goodyear Heights NeighborhoodEstimated Value: $96,000 - $115,000
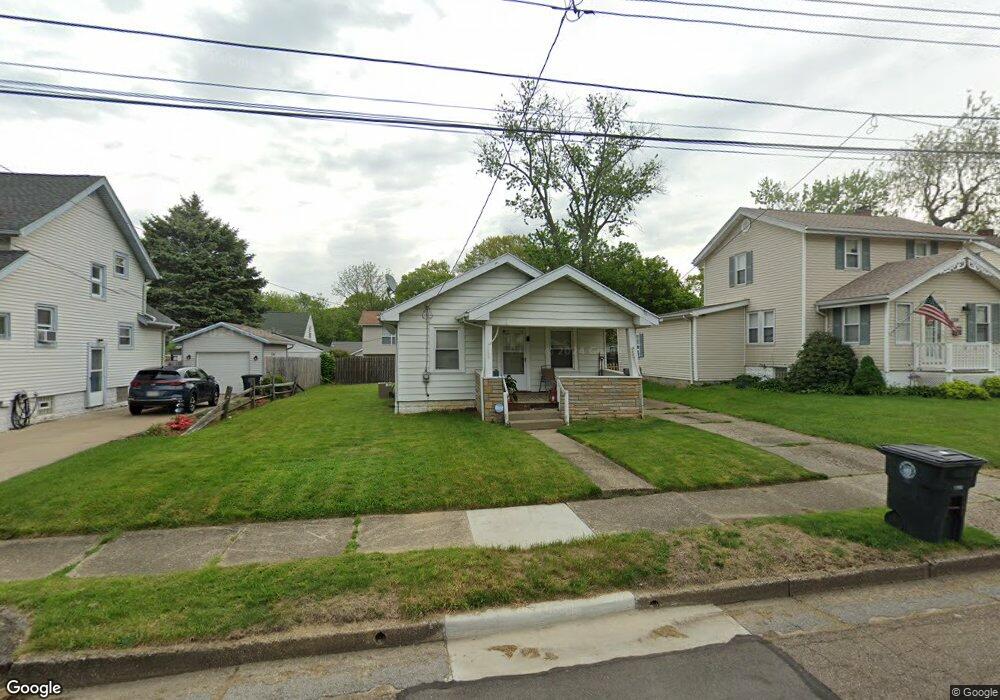
About This Home
This home is located at 345 Malacca St, Akron, OH 44305 and is currently estimated at $103,927, approximately $138 per square foot. 345 Malacca St is a home located in Summit County with nearby schools including Ellet High School, Akron Preparatory school, and Middlebury Academy.
Ownership History
We collect this data history from publicly available records. To have your information removed, we recommend requesting removal directly through your county’s website.
Purchase Details
Purchase Details
Purchase Details
Purchase Details
Home Financials for this Owner
Home Financials are based on the most recent Mortgage that was taken out on this home.Purchase Details
Home Values in the Area
Average Home Value in this Area
Purchase History
We collect this data history from publicly available records. To have your information removed, we recommend requesting removal directly through your county’s website.
| Date | Buyer | Sale Price | Title Company |
|---|---|---|---|
| $9,000 | None Available | ||
| $42,100 | Servicelink | ||
| $28,000 | None Available | ||
| $67,725 | None Available | ||
| -- | -- |
Mortgage History
We collect this data history from publicly available records. To have your information removed, we recommend requesting removal directly through your county’s website.
| Date | Status | Borrower | Loan Amount |
|---|---|---|---|
| Previous Owner | $66,725 |
Tax History
We collect this data history from publicly available records. To have your information removed, we recommend requesting removal directly through your county’s website.
| Year | Tax Paid | Tax Assessment Tax Assessment Total Assessment is a certain percentage of the fair market value that is determined by local assessors to be the total taxable value of land and additions on the property. | Land | Improvement |
|---|---|---|---|---|
| 2026 | $3,106 | $26,537 | $5,782 | $20,755 |
| 2024 | $1,489 | $26,537 | $5,782 | $20,755 |
| 2023 | $1,489 | $26,537 | $5,782 | $20,755 |
| 2022 | $1,466 | $20,507 | $4,379 | $16,128 |
| 2021 | $1,467 | $20,507 | $4,379 | $16,128 |
| 2020 | $1,446 | $20,510 | $4,380 | $16,130 |
| 2019 | $1,163 | $14,730 | $3,900 | $10,830 |
| 2018 | $1,149 | $14,730 | $3,900 | $10,830 |
| 2017 | $1,235 | $14,730 | $3,900 | $10,830 |
| 2016 | $1,236 | $14,730 | $3,900 | $10,830 |
| 2015 | $1,235 | $14,730 | $3,900 | $10,830 |
| 2014 | $1,227 | $14,730 | $3,900 | $10,830 |
| 2013 | $1,327 | $16,950 | $3,900 | $13,050 |
Map
- 295 Goodview Ave
- 405 the Brooklands
- 1904 Tonawanda Ave
- 425 Frazier Ave
- 1837 Cameroon Ct
- 238 the Brooklands
- 1801 Malasia Rd
- 330 Morningview Ave
- 2033 Eastlawn Ave
- 250 Morningview Ave
- 470 Sumatra Ave
- 462 Larkin Ave
- 2048 Congo St
- 144 Malacca St
- 143 Malacca St
- 512 Morningview Ave
- 1646 Ottawa Ave
- 1706 Hampton Rd
- 1921 Preston Ave
- 1927 Preston Ave
- 339 Malacca St
- 349 Malacca St
- 348 Frazier Ave
- 357 Malacca St
- 342 Frazier Ave
- 352 Frazier Ave
- 335 Malacca St
- 338 Frazier Ave
- 350 Frazier Ave
- 356 Malacca St
- 352 Malacca St
- 360 Malacca St
- 361 Malacca St
- 348 Malacca St
- 327 Malacca St
- 366 Malacca St
- 356 Frazier Ave
- 344 Malacca St
- 332 Frazier Ave
- 365 Malacca St
Ask me questions while you tour the home.