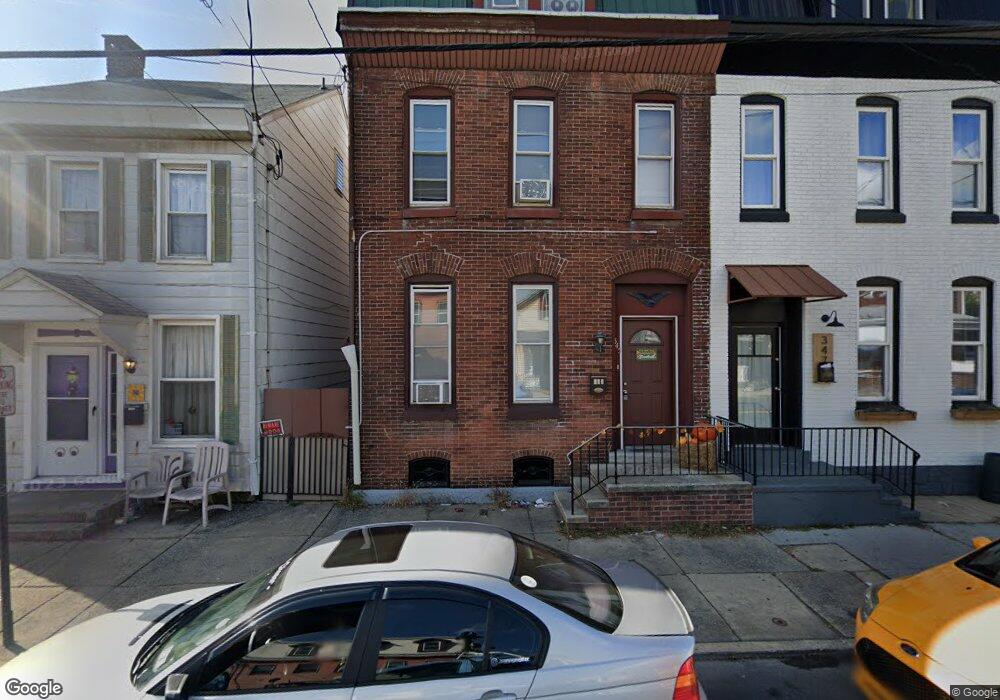
345 N 5th St Lebanon, PA 17046
Estimated Value: $151,000 - $202,325
5
Beds
2
Baths
2,196
Sq Ft
$83/Sq Ft
Est. Value
About This Home
This home is located at 345 N 5th St, Lebanon, PA 17046 and is currently estimated at $183,081, approximately $83 per square foot. 345 N 5th St is a home located in Lebanon County with nearby schools including Harding Elementary School, Houck Elementary School, and Northwest Elementary School.
Ownership History
Date
Name
Owned For
Owner Type
Purchase Details
Closed on
Feb 15, 2023
Sold by
Zook Amos L
Bought by
Kauffman Isaac K
Current Estimated Value
Home Financials for this Owner
Home Financials are based on the most recent Mortgage that was taken out on this home.
Original Mortgage
$138,800
Outstanding Balance
$111,037
Interest Rate
6.48%
Mortgage Type
Credit Line Revolving
Estimated Equity
$72,044
Purchase Details
Closed on
Apr 5, 2022
Sold by
Yiengst Joseph R and Yiengst Aimee A
Bought by
Zook Amos L
Home Financials for this Owner
Home Financials are based on the most recent Mortgage that was taken out on this home.
Original Mortgage
$130,000
Interest Rate
4.67%
Mortgage Type
New Conventional
Purchase Details
Closed on
Jul 11, 2014
Sold by
Drake Charles M and Hoffer Kenneth L
Bought by
Yiengst Joseph R and Yiengst Aimee A
Create a Home Valuation Report for This Property
The Home Valuation Report is an in-depth analysis detailing your home's value as well as a comparison with similar homes in the area
Home Values in the Area
Average Home Value in this Area
Purchase History
| Date | Buyer | Sale Price | Title Company |
|---|---|---|---|
| Kauffman Isaac K | $173,500 | -- | |
| Zook Amos L | $125,000 | None Listed On Document | |
| Yiengst Joseph R | $40,000 | None Available |
Source: Public Records
Mortgage History
| Date | Status | Borrower | Loan Amount |
|---|---|---|---|
| Open | Kauffman Isaac K | $138,800 | |
| Previous Owner | Zook Amos L | $130,000 |
Source: Public Records
Tax History Compared to Growth
Tax History
| Year | Tax Paid | Tax Assessment Tax Assessment Total Assessment is a certain percentage of the fair market value that is determined by local assessors to be the total taxable value of land and additions on the property. | Land | Improvement |
|---|---|---|---|---|
| 2025 | $2,226 | $69,100 | $7,200 | $61,900 |
| 2024 | $2,121 | $69,100 | $7,200 | $61,900 |
| 2023 | $2,121 | $69,100 | $7,200 | $61,900 |
| 2022 | $2,086 | $69,100 | $7,200 | $61,900 |
| 2021 | $2,015 | $69,100 | $7,200 | $61,900 |
| 2020 | $2,015 | $69,100 | $7,200 | $61,900 |
| 2019 | $1,986 | $69,100 | $7,200 | $61,900 |
| 2018 | $1,929 | $69,100 | $7,200 | $61,900 |
| 2017 | $544 | $69,100 | $7,200 | $61,900 |
| 2016 | $1,878 | $69,100 | $7,200 | $61,900 |
| 2015 | $1,290 | $69,100 | $7,200 | $61,900 |
| 2014 | $1,290 | $69,100 | $7,200 | $61,900 |
Source: Public Records
Map
Nearby Homes