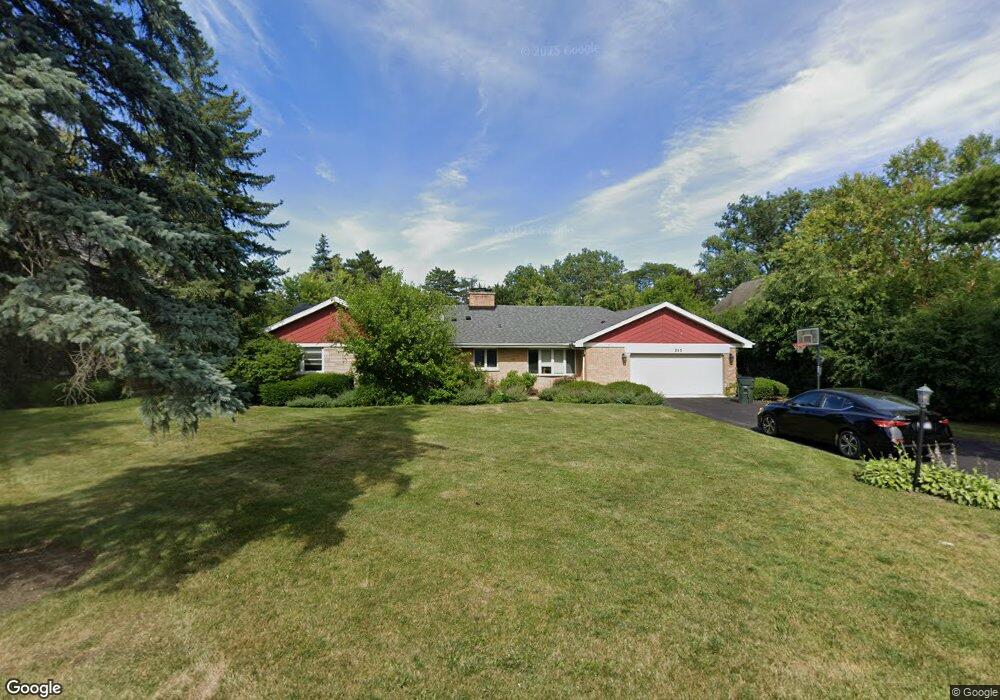
345 N Branch Rd Glenview, IL 60025
Estimated Value: $1,128,879 - $1,305,000
3
Beds
3
Baths
2,500
Sq Ft
$500/Sq Ft
Est. Value
About This Home
This home is located at 345 N Branch Rd, Glenview, IL 60025 and is currently estimated at $1,249,220, approximately $499 per square foot. 345 N Branch Rd is a home located in Cook County with nearby schools including Lyon Elementary School, Pleasant Ridge Elementary School, and Springman Middle School.
Ownership History
Date
Name
Owned For
Owner Type
Purchase Details
Closed on
Jan 15, 2019
Sold by
Ishkhanian Vicken
Bought by
Declara Ishkhanian Vicken and Vicken Ishkhanian 2019 Declaration Of Tr
Current Estimated Value
Purchase Details
Closed on
Mar 2, 2017
Sold by
Ishkhanian Vicken and Ishkhanian Lucie
Bought by
Ishkhanian Vicken
Home Financials for this Owner
Home Financials are based on the most recent Mortgage that was taken out on this home.
Original Mortgage
$375,000
Outstanding Balance
$64,293
Interest Rate
3.25%
Mortgage Type
New Conventional
Estimated Equity
$1,184,927
Purchase Details
Closed on
May 29, 2010
Sold by
Livi Kearney Agnes E
Bought by
Ishkhanian Vicken and Ishkhanian Lucie
Home Financials for this Owner
Home Financials are based on the most recent Mortgage that was taken out on this home.
Original Mortgage
$520,000
Interest Rate
4.97%
Mortgage Type
Stand Alone Second
Purchase Details
Closed on
May 20, 2009
Sold by
Kearney Agnes E
Bought by
Agnes E Kearney Revocable Living Trust
Create a Home Valuation Report for This Property
The Home Valuation Report is an in-depth analysis detailing your home's value as well as a comparison with similar homes in the area
Home Values in the Area
Average Home Value in this Area
Purchase History
| Date | Buyer | Sale Price | Title Company |
|---|---|---|---|
| Declara Ishkhanian Vicken | -- | None Available | |
| Ishkhanian Vicken | -- | None Available | |
| Ishkhanian Vicken | $673,000 | Bt | |
| Agnes E Kearney Revocable Living Trust | -- | Chicago Title Insurance Co |
Source: Public Records
Mortgage History
| Date | Status | Borrower | Loan Amount |
|---|---|---|---|
| Open | Ishkhanian Vicken | $375,000 | |
| Closed | Ishkhanian Vicken | $520,000 |
Source: Public Records
Tax History Compared to Growth
Tax History
| Year | Tax Paid | Tax Assessment Tax Assessment Total Assessment is a certain percentage of the fair market value that is determined by local assessors to be the total taxable value of land and additions on the property. | Land | Improvement |
|---|---|---|---|---|
| 2024 | $17,126 | $77,232 | $30,426 | $46,806 |
| 2023 | $16,623 | $80,987 | $30,426 | $50,561 |
| 2022 | $16,623 | $80,987 | $30,426 | $50,561 |
| 2021 | $15,348 | $65,212 | $16,596 | $48,616 |
| 2020 | $15,226 | $65,212 | $16,596 | $48,616 |
| 2019 | $14,186 | $71,662 | $16,596 | $55,066 |
| 2018 | $13,342 | $61,637 | $13,830 | $47,807 |
| 2017 | $13,001 | $61,637 | $13,830 | $47,807 |
| 2016 | $12,467 | $61,637 | $13,830 | $47,807 |
| 2015 | $13,578 | $59,847 | $11,064 | $48,783 |
| 2014 | $13,334 | $59,847 | $11,064 | $48,783 |
| 2013 | $12,914 | $59,847 | $11,064 | $48,783 |
Source: Public Records
Map
Nearby Homes
- 1123 Longvalley Rd
- 1121 Longvalley Rd
- 601 Carriage Hill Dr
- 609 Carriage Hill Dr
- 711 Carriage Hill Dr
- 713 Carriage Hill Dr
- 1821 George Ct
- 245 Nora Ave
- 1125 Longvalley Rd
- 315 Lincoln St
- 1119 Longvalley Rd
- 1800 Dewes St Unit 305
- 1800 Dewes St Unit 201
- 6619 Palma Ln
- 7030 Foster St
- 809 Lenox Rd
- 9523 Oconto Ave
- 517 Briarhill Ln
- 7324 Palma Ln
- 6909 Beckwith Rd
- 339 N Branch Rd
- 401 N Branch Rd
- 333 N Branch Rd
- 1529 Longvalley Rd
- 1541 Longvalley Rd
- 415 N Branch Rd
- 348 N Branch Rd
- 342 N Branch Rd
- 400 N Branch Rd
- 323 N Branch Rd
- 400 Country Ln
- 1515 Longvalley Rd
- 336 N Branch Rd
- 410 N Branch Rd
- 340 Country Ln
- 414 N Branch Rd
- 330 N Branch Rd
- 334 Country Ln
- 315 N Branch Rd
- 420 N Branch Rd