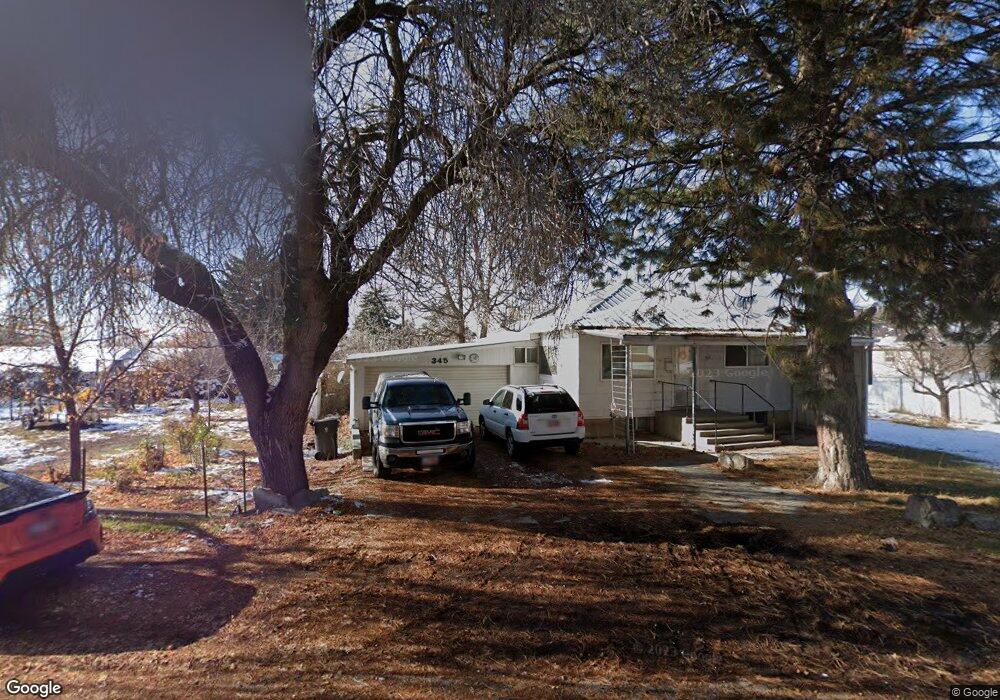
345 N Main St Pleasant Grove, UT 84062
Estimated Value: $440,000 - $504,379
4
Beds
2
Baths
1,794
Sq Ft
$268/Sq Ft
Est. Value
About This Home
This home is located at 345 N Main St, Pleasant Grove, UT 84062 and is currently estimated at $480,845, approximately $268 per square foot. 345 N Main St is a home located in Utah County with nearby schools including Central Elementary School, Pleasant Grove Junior High School, and Pleasant Grove High School.
Ownership History
Date
Name
Owned For
Owner Type
Purchase Details
Closed on
Jul 24, 2020
Sold by
Fisher Danielle M and Fisher Jeremy G
Bought by
Fisher Danielle M and Fisher Jeremy B
Current Estimated Value
Home Financials for this Owner
Home Financials are based on the most recent Mortgage that was taken out on this home.
Original Mortgage
$180,000
Outstanding Balance
$158,952
Interest Rate
3%
Mortgage Type
New Conventional
Estimated Equity
$321,893
Purchase Details
Closed on
Nov 17, 2012
Sold by
Harris Nena and Williamson Angelina F
Bought by
Fisher Danielle M
Create a Home Valuation Report for This Property
The Home Valuation Report is an in-depth analysis detailing your home's value as well as a comparison with similar homes in the area
Home Values in the Area
Average Home Value in this Area
Purchase History
| Date | Buyer | Sale Price | Title Company |
|---|---|---|---|
| Fisher Danielle M | -- | Advantage Title Llc | |
| Fisher Danielle M | -- | American Preferrd Title |
Source: Public Records
Mortgage History
| Date | Status | Borrower | Loan Amount |
|---|---|---|---|
| Open | Fisher Danielle M | $180,000 |
Source: Public Records
Tax History Compared to Growth
Tax History
| Year | Tax Paid | Tax Assessment Tax Assessment Total Assessment is a certain percentage of the fair market value that is determined by local assessors to be the total taxable value of land and additions on the property. | Land | Improvement |
|---|---|---|---|---|
| 2025 | $1,913 | $249,095 | $241,900 | $211,000 |
| 2024 | $1,913 | $228,250 | $0 | $0 |
| 2023 | $1,837 | $224,400 | $0 | $0 |
| 2022 | $1,988 | $241,725 | $0 | $0 |
| 2021 | $1,713 | $317,000 | $173,600 | $143,400 |
| 2020 | $1,573 | $285,400 | $155,000 | $130,400 |
| 2019 | $1,363 | $255,800 | $142,400 | $113,400 |
| 2018 | $1,317 | $233,700 | $129,900 | $103,800 |
| 2017 | $1,238 | $116,985 | $0 | $0 |
| 2016 | $1,213 | $110,660 | $0 | $0 |
| 2015 | $1,281 | $110,660 | $0 | $0 |
| 2014 | $1,277 | $109,230 | $0 | $0 |
Source: Public Records
Map
Nearby Homes