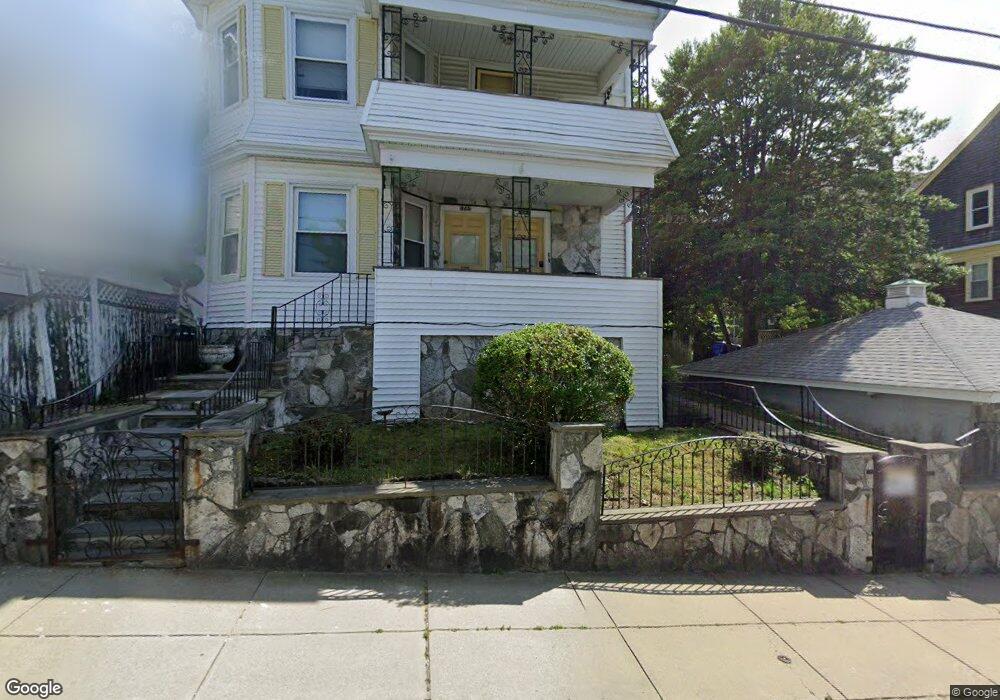
345 Pearce St Fall River, MA 02720
Lower Highlands NeighborhoodEstimated Value: $658,000 - $862,000
6
Beds
3
Baths
4,074
Sq Ft
$179/Sq Ft
Est. Value
About This Home
This home is located at 345 Pearce St, Fall River, MA 02720 and is currently estimated at $727,559, approximately $178 per square foot. 345 Pearce St is a home located in Bristol County with nearby schools including Mary Fonseca Elementary School, Morton Middle School, and B M C Durfee High School.
Ownership History
Date
Name
Owned For
Owner Type
Purchase Details
Closed on
Aug 26, 2005
Sold by
Montgomery Rt
Bought by
Rocha Derek M and Correia Jose
Current Estimated Value
Home Financials for this Owner
Home Financials are based on the most recent Mortgage that was taken out on this home.
Original Mortgage
$288,750
Outstanding Balance
$152,828
Interest Rate
5.68%
Mortgage Type
Purchase Money Mortgage
Estimated Equity
$574,731
Purchase Details
Closed on
Apr 4, 2005
Sold by
High Pearce Rt
Bought by
Montgomery Rt
Home Financials for this Owner
Home Financials are based on the most recent Mortgage that was taken out on this home.
Original Mortgage
$325,000
Interest Rate
5.61%
Mortgage Type
Purchase Money Mortgage
Purchase Details
Closed on
Nov 15, 2004
Sold by
Carreiro Manuel L Est
Bought by
High Pearce Rt
Create a Home Valuation Report for This Property
The Home Valuation Report is an in-depth analysis detailing your home's value as well as a comparison with similar homes in the area
Home Values in the Area
Average Home Value in this Area
Purchase History
| Date | Buyer | Sale Price | Title Company |
|---|---|---|---|
| Rocha Derek M | $385,000 | -- | |
| Montgomery Rt | $325,000 | -- | |
| High Pearce Rt | $255,000 | -- |
Source: Public Records
Mortgage History
| Date | Status | Borrower | Loan Amount |
|---|---|---|---|
| Open | Rocha Derek M | $288,750 | |
| Previous Owner | Montgomery Rt | $325,000 | |
| Previous Owner | High Pearce Rt | $130,500 |
Source: Public Records
Tax History
| Year | Tax Paid | Tax Assessment Tax Assessment Total Assessment is a certain percentage of the fair market value that is determined by local assessors to be the total taxable value of land and additions on the property. | Land | Improvement |
|---|---|---|---|---|
| 2025 | $6,987 | $610,200 | $116,300 | $493,900 |
| 2024 | $6,699 | $583,000 | $114,000 | $469,000 |
| 2023 | $6,079 | $495,400 | $102,700 | $392,700 |
| 2022 | $5,403 | $428,100 | $96,900 | $331,200 |
| 2021 | $5,127 | $370,700 | $92,600 | $278,100 |
| 2020 | $4,573 | $316,500 | $88,400 | $228,100 |
| 2019 | $4,007 | $274,800 | $92,400 | $182,400 |
| 2018 | $3,744 | $256,100 | $90,900 | $165,200 |
| 2017 | $3,585 | $256,100 | $90,900 | $165,200 |
| 2016 | $3,503 | $257,000 | $95,700 | $161,300 |
| 2015 | $3,363 | $257,100 | $95,700 | $161,400 |
| 2014 | $3,418 | $271,700 | $95,700 | $176,000 |
Source: Public Records
Map
Nearby Homes
- 909 High St Unit 1
- 889 High St
- 267 Lincoln Ave
- 327 Brownell St
- 33-35 Malvey St
- 11 Dyer St
- 503 Highland Ave
- 72 Belmont St
- 10 N Court St Unit 3
- 376 N Underwood St
- 302 Cory St
- 499 Hanover St
- 213 Weetamoe St
- 301 Madison St
- 102 Vestal St
- 750 Davol St Unit 1012
- 750 Davol St Unit 219
- 750 Davol St Unit 221
- 750 Davol St Unit 616
- 750 Davol St Unit 214
Your Personal Tour Guide
Ask me questions while you tour the home.