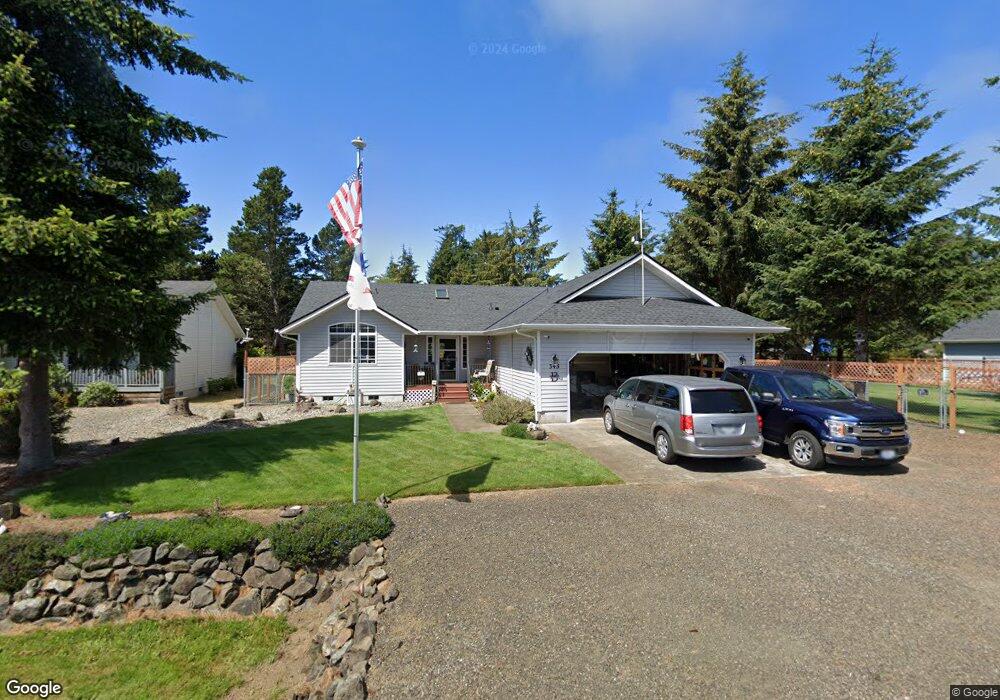
345 Ponderosa Loop NE Ocean Shores, WA 98569
Estimated Value: $417,055 - $507,000
3
Beds
2
Baths
1,613
Sq Ft
$281/Sq Ft
Est. Value
About This Home
This home is located at 345 Ponderosa Loop NE, Ocean Shores, WA 98569 and is currently estimated at $454,014, approximately $281 per square foot. 345 Ponderosa Loop NE is a home located in Grays Harbor County with nearby schools including North Beach Junior/Senior High School.
Ownership History
Date
Name
Owned For
Owner Type
Purchase Details
Closed on
Jul 13, 2007
Sold by
Rowlands Willard E and Rowlands Mikeleene A
Bought by
Butler Paul C and Butler Merri G
Current Estimated Value
Home Financials for this Owner
Home Financials are based on the most recent Mortgage that was taken out on this home.
Original Mortgage
$110,000
Outstanding Balance
$69,575
Interest Rate
6.73%
Mortgage Type
New Conventional
Estimated Equity
$384,439
Create a Home Valuation Report for This Property
The Home Valuation Report is an in-depth analysis detailing your home's value as well as a comparison with similar homes in the area
Home Values in the Area
Average Home Value in this Area
Purchase History
| Date | Buyer | Sale Price | Title Company |
|---|---|---|---|
| Butler Paul C | $220,000 | Grays Harbor Title |
Source: Public Records
Mortgage History
| Date | Status | Borrower | Loan Amount |
|---|---|---|---|
| Open | Butler Paul C | $110,000 |
Source: Public Records
Tax History Compared to Growth
Tax History
| Year | Tax Paid | Tax Assessment Tax Assessment Total Assessment is a certain percentage of the fair market value that is determined by local assessors to be the total taxable value of land and additions on the property. | Land | Improvement |
|---|---|---|---|---|
| 2025 | $2,604 | $411,283 | $45,000 | $366,283 |
| 2023 | $2,631 | $429,735 | $75,000 | $354,735 |
| 2022 | $2,401 | $284,049 | $54,200 | $229,849 |
| 2021 | $2,778 | $284,049 | $54,200 | $229,849 |
| 2020 | $2,609 | $269,061 | $37,375 | $231,686 |
| 2019 | $2,589 | $243,124 | $32,500 | $210,624 |
| 2018 | $2,348 | $235,028 | $25,000 | $210,028 |
| 2017 | $2,090 | $201,486 | $25,000 | $176,486 |
| 2016 | $1,958 | $175,515 | $22,000 | $153,515 |
| 2014 | -- | $171,135 | $12,000 | $159,135 |
| 2013 | -- | $189,890 | $15,000 | $174,890 |
Source: Public Records
Map
Nearby Homes
- 441 Bass Ave NE
- 276 Bass Ave NE
- 247 Bass Ave NE
- 260 Dolphin Ave NE
- 308 Lakeview Loop NE
- 314 Lakeview Loop NE
- 430 Dolphin Ave NE
- 470 Lake West Loop NE
- 337 Hyde Ct NE
- 445 Bass Ave NE
- 336 Hyde Ct NE
- 433 Dolphin Ave NE
- 212 Dolphin Ave NE
- 360 Lakeview Loop NE
- 366 Lakeview Loop NE
- 242 Duck Lake Dr NE
- 341 Duck Lake Dr NE
- 359 Duck Lake Dr NE
- 394 Lakeview Loop NE
- 387 Duck Lake Dr NE
- 347 Ponderosa Loop NE
- 350 Bass Ave NE
- 356 Bass Ave NE
- 342 Bass Ave NE
- 339 Ponderosa Loop NE
- 351 Ponderosa Loop NE
- 362 Bass Ave NE
- 336 Bass Ave NE
- 346 Ponderosa Loop NE
- 335 Ponderosa Loop NE
- 348 Ponderosa Loop NE
- 340 Ponderosa Loop NE
- 370 Bass Ave NE
- 336 Ponderosa Loop NE
- 331 Ponderosa Loop NE
- 354 Ponderosa Loop NE
- 376 Bass Ave NE
- 334 Ponderosa Loop NE