Estimated Value: $338,140 - $365,000
About This Home
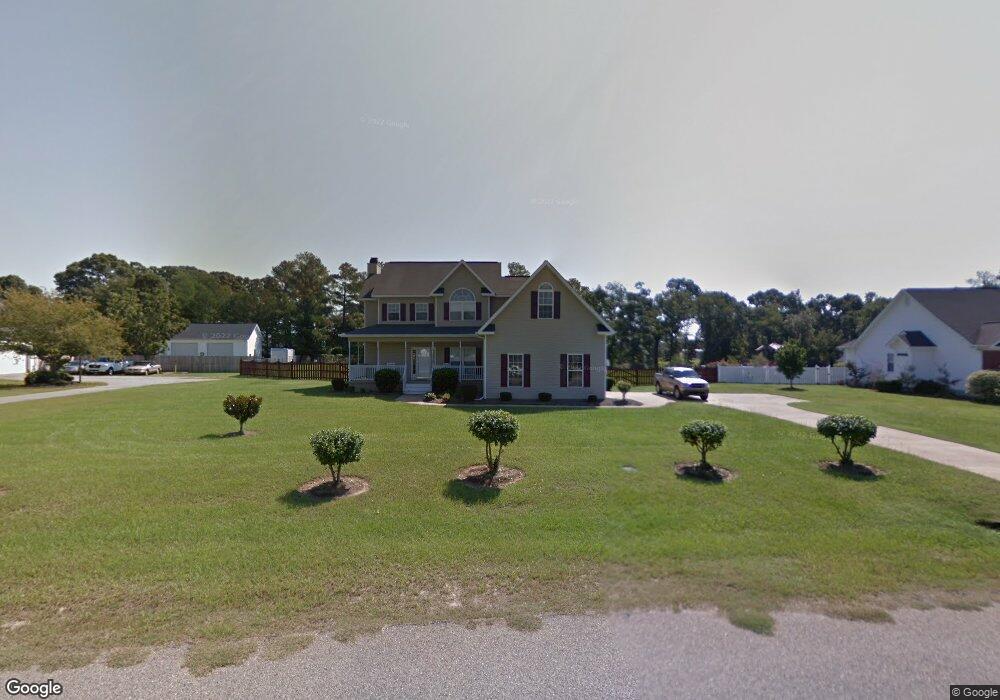
This home is located at 345 Ruben Rd, Byron, GA 31008 and is currently estimated at $352,285, approximately $134 per square foot. 345 Ruben Rd is a home located in Peach County with nearby schools including Kay Road Elementary School, Fort Valley Middle School, and Peach County High School.
Ownership History
We collect this data history from publicly available records. To have your information removed, we recommend requesting removal directly through your county’s website.
Purchase Details
Home Financials for this Owner
Home Financials are based on the most recent Mortgage that was taken out on this home.Purchase Details
Home Financials for this Owner
Home Financials are based on the most recent Mortgage that was taken out on this home.Purchase Details
Purchase Details
Purchase Details
Home Values in the Area
Average Home Value in this Area
Purchase History
We collect this data history from publicly available records. To have your information removed, we recommend requesting removal directly through your county’s website.
| Date | Buyer | Sale Price | Title Company |
|---|---|---|---|
| $199,900 | -- | ||
| $210,000 | -- | ||
| $184,900 | -- | ||
| -- | -- | ||
| -- | -- |
Mortgage History
We collect this data history from publicly available records. To have your information removed, we recommend requesting removal directly through your county’s website.
| Date | Status | Borrower | Loan Amount |
|---|---|---|---|
| Open | $199,900 | ||
| Previous Owner | $216,930 |
Tax History
We collect this data history from publicly available records. To have your information removed, we recommend requesting removal directly through your county’s website.
| Year | Tax Paid | Tax Assessment Tax Assessment Total Assessment is a certain percentage of the fair market value that is determined by local assessors to be the total taxable value of land and additions on the property. | Land | Improvement |
|---|---|---|---|---|
| 2025 | $2,945 | $105,920 | $12,280 | $93,640 |
| 2024 | $2,947 | $102,800 | $12,640 | $90,160 |
| 2023 | $2,907 | $100,400 | $12,640 | $87,760 |
| 2022 | $2,604 | $89,160 | $12,640 | $76,520 |
| 2021 | $2,608 | $77,000 | $12,640 | $64,360 |
| 2020 | $2,701 | $81,320 | $12,640 | $68,680 |
| 2019 | $2,693 | $79,320 | $12,640 | $66,680 |
| 2018 | $2,705 | $79,320 | $12,640 | $66,680 |
| 2017 | $2,718 | $79,320 | $12,640 | $66,680 |
| 2016 | $2,644 | $79,320 | $12,640 | $66,680 |
| 2015 | $2,648 | $79,320 | $12,640 | $66,680 |
| 2014 | $2,652 | $79,320 | $12,640 | $66,680 |
| 2013 | -- | $87,920 | $12,640 | $75,280 |
Map
- 128 Mary Lou Dr
- 137 Red Tail Cir
- 165 Early Dr
- 161 Rowland Cir
- 129 Early Dr
- 124 Early Dr
- 109 Hawks Ridge Trace
- 132 Early Dr
- 120 Early Dr
- 0 Barker Rd Unit 243030
- 0 Barker Rd Unit 14258525
- 0 Barker Rd Unit 175053
- 116 Early Dr
- 107 Red Tail Cir
- 109 Red Tail Cir
- 134 Early Dr
- 119 Early Dr
- 117 Early Dr
- Lot 6 Trojan Way
- Lot 1 Trojan Way
Ask me questions while you tour the home.