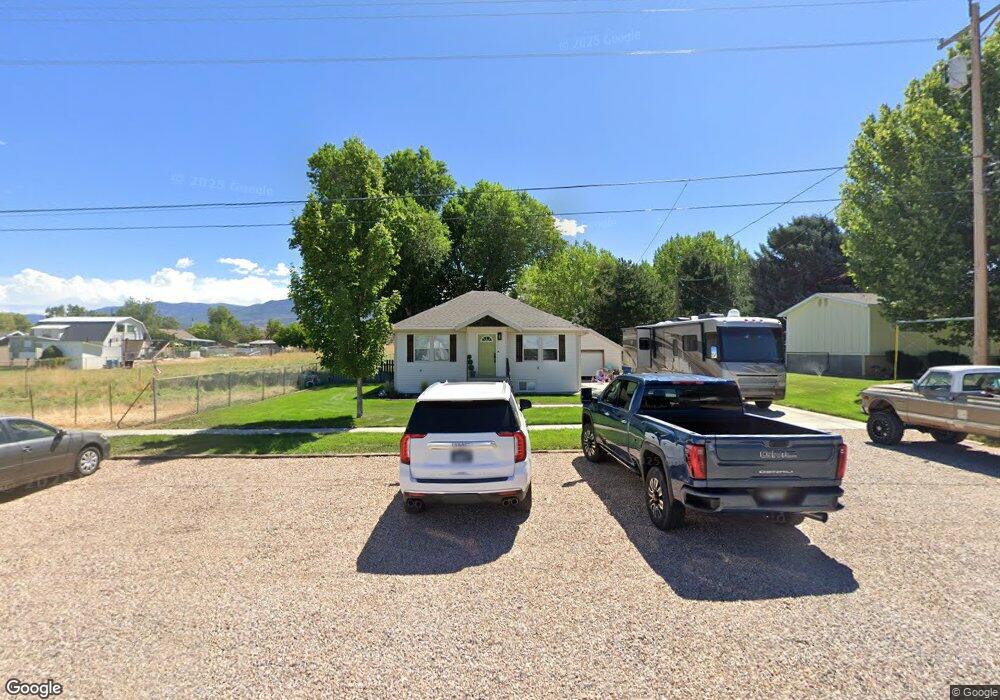
345 S 100 W Fillmore, UT 84631
Estimated Value: $265,000 - $330,659
4
Beds
2
Baths
1,780
Sq Ft
$172/Sq Ft
Est. Value
About This Home
This home is located at 345 S 100 W, Fillmore, UT 84631 and is currently estimated at $306,165, approximately $172 per square foot. 345 S 100 W is a home located in Millard County.
Ownership History
Date
Name
Owned For
Owner Type
Purchase Details
Closed on
Aug 21, 2025
Sold by
Kesler Keith
Bought by
Kesler Keith and Kesler Jessica
Current Estimated Value
Home Financials for this Owner
Home Financials are based on the most recent Mortgage that was taken out on this home.
Original Mortgage
$330,000
Outstanding Balance
$329,714
Interest Rate
6.72%
Mortgage Type
VA
Estimated Equity
-$23,549
Purchase Details
Closed on
Aug 19, 2025
Sold by
Johnson Rusty and Johnson Charity
Bought by
Kesler Keith
Home Financials for this Owner
Home Financials are based on the most recent Mortgage that was taken out on this home.
Original Mortgage
$330,000
Outstanding Balance
$329,714
Interest Rate
6.72%
Mortgage Type
VA
Estimated Equity
-$23,549
Purchase Details
Closed on
Jan 30, 2024
Sold by
Holding Allen W and Holding Tina Marie
Bought by
Johnson Rusty and Johnson Charity
Home Financials for this Owner
Home Financials are based on the most recent Mortgage that was taken out on this home.
Original Mortgage
$276,450
Interest Rate
6.61%
Mortgage Type
New Conventional
Purchase Details
Closed on
Mar 28, 2008
Sold by
Beckstrand Richard O and Beckstrand Sheri Kay
Bought by
Bailey Chad S and Bailey Mckenzie E
Home Financials for this Owner
Home Financials are based on the most recent Mortgage that was taken out on this home.
Original Mortgage
$8,801
Interest Rate
6.22%
Purchase Details
Closed on
Oct 4, 2007
Sold by
Caso Kimberly L
Bought by
Beckstrand Richard O and Beckstrand Sheri Kay
Create a Home Valuation Report for This Property
The Home Valuation Report is an in-depth analysis detailing your home's value as well as a comparison with similar homes in the area
Home Values in the Area
Average Home Value in this Area
Purchase History
| Date | Buyer | Sale Price | Title Company |
|---|---|---|---|
| Kesler Keith | -- | First American Title Insurance | |
| Kesler Keith | -- | First American Title Insurance | |
| Johnson Rusty | -- | First American Title Insurance | |
| Bailey Chad S | -- | -- | |
| Beckstrand Richard O | -- | -- |
Source: Public Records
Mortgage History
| Date | Status | Borrower | Loan Amount |
|---|---|---|---|
| Open | Kesler Keith | $330,000 | |
| Closed | Kesler Keith | $330,000 | |
| Previous Owner | Johnson Rusty | $276,450 | |
| Previous Owner | Bailey Chad S | $8,801 | |
| Previous Owner | Bailey Chad S | $146,697 |
Source: Public Records
Tax History Compared to Growth
Tax History
| Year | Tax Paid | Tax Assessment Tax Assessment Total Assessment is a certain percentage of the fair market value that is determined by local assessors to be the total taxable value of land and additions on the property. | Land | Improvement |
|---|---|---|---|---|
| 2025 | $1,161 | $145,838 | $33,086 | $112,752 |
| 2024 | $1,161 | $128,569 | $25,596 | $102,973 |
| 2023 | $1,395 | $128,569 | $25,596 | $102,973 |
| 2022 | $1,168 | $104,903 | $23,269 | $81,634 |
| 2021 | $1,009 | $87,025 | $15,110 | $71,915 |
| 2020 | $934 | $80,987 | $13,736 | $67,251 |
| 2019 | $802 | $69,738 | $13,736 | $56,002 |
| 2018 | $766 | $68,159 | $13,736 | $54,423 |
| 2017 | $672 | $56,887 | $13,736 | $43,151 |
| 2016 | $643 | $56,887 | $13,736 | $43,151 |
| 2015 | $643 | $56,887 | $13,736 | $43,151 |
| 2014 | -- | $56,887 | $13,736 | $43,151 |
| 2013 | -- | $56,887 | $13,736 | $43,151 |
Source: Public Records
Map
Nearby Homes
- 190 W 400 St S
- 155 E 500 St S
- 157 E 500 South St
- 220 S 200 E
- 40 S 100 Rd E
- 310 S 500 West Rd
- 75 N 100 West St
- 405 E 500 St S
- 430 E Canyon Rd
- 165 N 100 W
- 225 W 200 St N
- 310 S 600 E
- 760 E 700 St S
- 295 N 100 West St
- 690 E 500 S
- 390 N 100 W
- 380 N 200 St W
- 335 W 400 North St
- 750 800 South Fillmore
- 825 800 South Fillmore