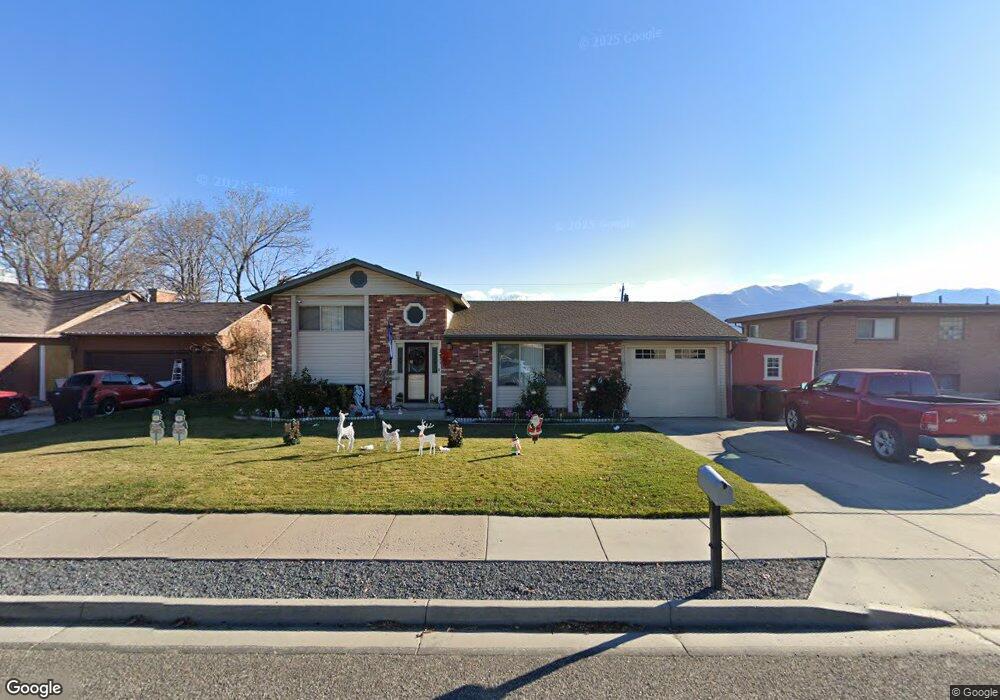
345 S Main St Garland, UT 84312
Estimated Value: $313,000 - $346,300
4
Beds
1
Bath
1,620
Sq Ft
$204/Sq Ft
Est. Value
About This Home
This home is located at 345 S Main St, Garland, UT 84312 and is currently estimated at $329,825, approximately $203 per square foot. 345 S Main St is a home located in Box Elder County with nearby schools including Garland School, Bear River Middle School, and Alice C. Harris Intermediate School.
Ownership History
Date
Name
Owned For
Owner Type
Purchase Details
Closed on
Mar 7, 2022
Sold by
Sig Kabai
Bought by
Kabai Sig and Kabai Simona
Current Estimated Value
Home Financials for this Owner
Home Financials are based on the most recent Mortgage that was taken out on this home.
Original Mortgage
$111,600
Outstanding Balance
$76,293
Interest Rate
3.01%
Mortgage Type
New Conventional
Estimated Equity
$253,532
Purchase Details
Closed on
Aug 27, 2015
Sold by
Pierce Marla Jean
Bought by
Kabai Sig
Home Financials for this Owner
Home Financials are based on the most recent Mortgage that was taken out on this home.
Original Mortgage
$125,510
Interest Rate
4.05%
Mortgage Type
New Conventional
Create a Home Valuation Report for This Property
The Home Valuation Report is an in-depth analysis detailing your home's value as well as a comparison with similar homes in the area
Home Values in the Area
Average Home Value in this Area
Purchase History
| Date | Buyer | Sale Price | Title Company |
|---|---|---|---|
| Kabai Sig | -- | Vantage Point Title | |
| Kabai Sig | -- | American Secure Title Tremon |
Source: Public Records
Mortgage History
| Date | Status | Borrower | Loan Amount |
|---|---|---|---|
| Open | Kabai Sig | $111,600 | |
| Previous Owner | Kabai Sig | $125,510 |
Source: Public Records
Tax History Compared to Growth
Tax History
| Year | Tax Paid | Tax Assessment Tax Assessment Total Assessment is a certain percentage of the fair market value that is determined by local assessors to be the total taxable value of land and additions on the property. | Land | Improvement |
|---|---|---|---|---|
| 2025 | $1,869 | $290,354 | $105,000 | $185,354 |
| 2024 | $1,609 | $282,130 | $100,000 | $182,130 |
| 2023 | $1,598 | $276,359 | $90,000 | $186,359 |
| 2022 | $1,492 | $241,599 | $25,000 | $216,599 |
| 2021 | $1,145 | $149,005 | $25,000 | $124,005 |
| 2020 | $1,054 | $149,005 | $25,000 | $124,005 |
| 2019 | $989 | $74,106 | $13,750 | $60,356 |
| 2018 | $828 | $57,006 | $13,750 | $43,256 |
| 2017 | $847 | $103,648 | $13,750 | $78,648 |
| 2016 | $802 | $54,947 | $13,750 | $41,197 |
| 2015 | $755 | $51,202 | $13,750 | $37,452 |
| 2014 | $755 | $49,418 | $13,750 | $35,668 |
| 2013 | -- | $49,419 | $13,338 | $36,081 |
Source: Public Records
Map
Nearby Homes