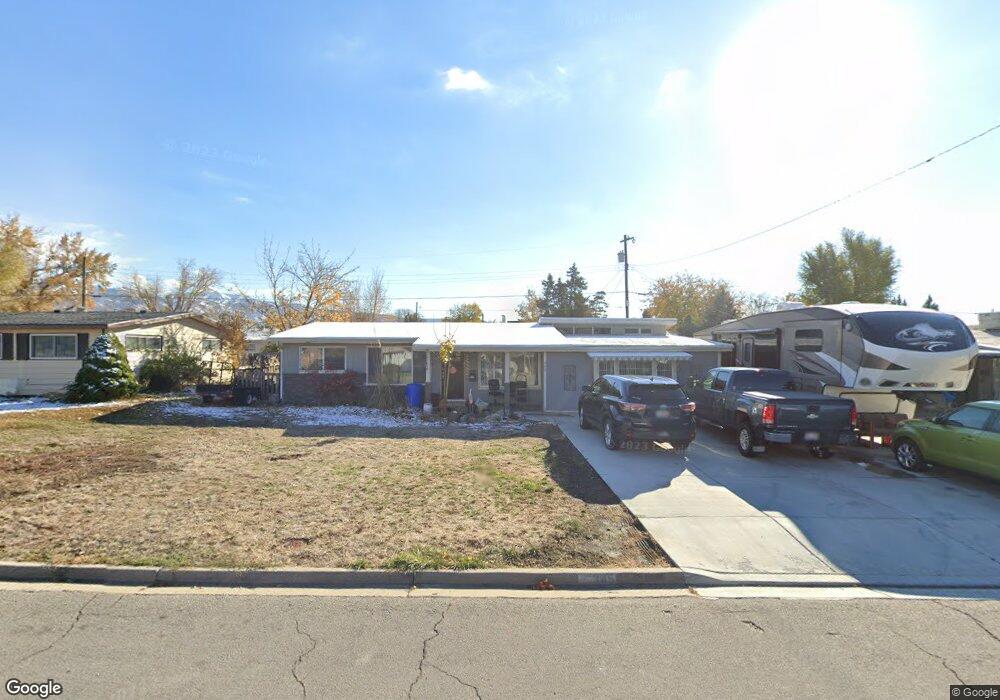
345 W 1050 N Bountiful, UT 84010
Estimated Value: $435,000 - $484,000
3
Beds
2
Baths
1,645
Sq Ft
$280/Sq Ft
Est. Value
About This Home
This home is located at 345 W 1050 N, Bountiful, UT 84010 and is currently estimated at $460,687, approximately $280 per square foot. 345 W 1050 N is a home located in Davis County with nearby schools including Meadowbrook Elementary School, Bountiful Junior High School, and Viewmont High School.
Ownership History
Date
Name
Owned For
Owner Type
Purchase Details
Closed on
Sep 10, 2003
Sold by
Sessions Theral W and Sessions Colleen J
Bought by
Bellamy Jeffrey B and Bellamy Rita Mae
Current Estimated Value
Home Financials for this Owner
Home Financials are based on the most recent Mortgage that was taken out on this home.
Original Mortgage
$134,883
Outstanding Balance
$61,295
Interest Rate
6.06%
Mortgage Type
FHA
Estimated Equity
$399,392
Purchase Details
Closed on
Oct 10, 2001
Sold by
Sessions Theral W and Sessions Colleen J
Bought by
Sessions Theral W and Sessions Colleen J
Create a Home Valuation Report for This Property
The Home Valuation Report is an in-depth analysis detailing your home's value as well as a comparison with similar homes in the area
Purchase History
| Date | Buyer | Sale Price | Title Company |
|---|---|---|---|
| Bellamy Jeffrey B | -- | First American Title Co | |
| Sessions Theral W | -- | -- |
Source: Public Records
Mortgage History
| Date | Status | Borrower | Loan Amount |
|---|---|---|---|
| Open | Bellamy Jeffrey B | $134,883 |
Source: Public Records
Tax History
| Year | Tax Paid | Tax Assessment Tax Assessment Total Assessment is a certain percentage of the fair market value that is determined by local assessors to be the total taxable value of land and additions on the property. | Land | Improvement |
|---|---|---|---|---|
| 2025 | $2,574 | $231,550 | $127,547 | $104,003 |
| 2024 | $2,402 | $224,950 | $112,587 | $112,363 |
| 2023 | $2,291 | $389,000 | $208,455 | $180,545 |
| 2022 | $2,517 | $210,100 | $114,184 | $95,916 |
| 2021 | $2,095 | $298,000 | $149,380 | $148,620 |
| 2020 | $1,847 | $263,000 | $127,978 | $135,022 |
| 2019 | $1,868 | $260,000 | $137,730 | $122,270 |
| 2018 | $1,727 | $236,000 | $135,067 | $100,933 |
| 2016 | $1,418 | $104,445 | $55,716 | $48,729 |
| 2015 | $1,409 | $98,065 | $55,716 | $42,349 |
| 2014 | $1,379 | $98,811 | $55,716 | $43,095 |
| 2013 | -- | $94,923 | $36,190 | $58,733 |
Source: Public Records
Map
Nearby Homes
- 366 W 1000 N
- 1130 N 200 W
- 184 Park Shadows Cir
- 235 W 1400 N
- 1260 N 200 W
- 563 N 200 W
- 106 W 700 N
- 499 N 200 W Unit 30
- 1520 N 550 W
- 401 W 400 N Unit 49
- 1625 Pages Place
- 399 W 400 N Unit 47
- 328 W Pages Ln
- 332 N 300 W
- 290 N 500 W Unit 108
- 290 N 500 W Unit 305
- 320 N 200 W Unit 4
- 1420 N Main St
- 951 Centerville Commons Way
- 204 Lyman Ln
Your Personal Tour Guide
Ask me questions while you tour the home.