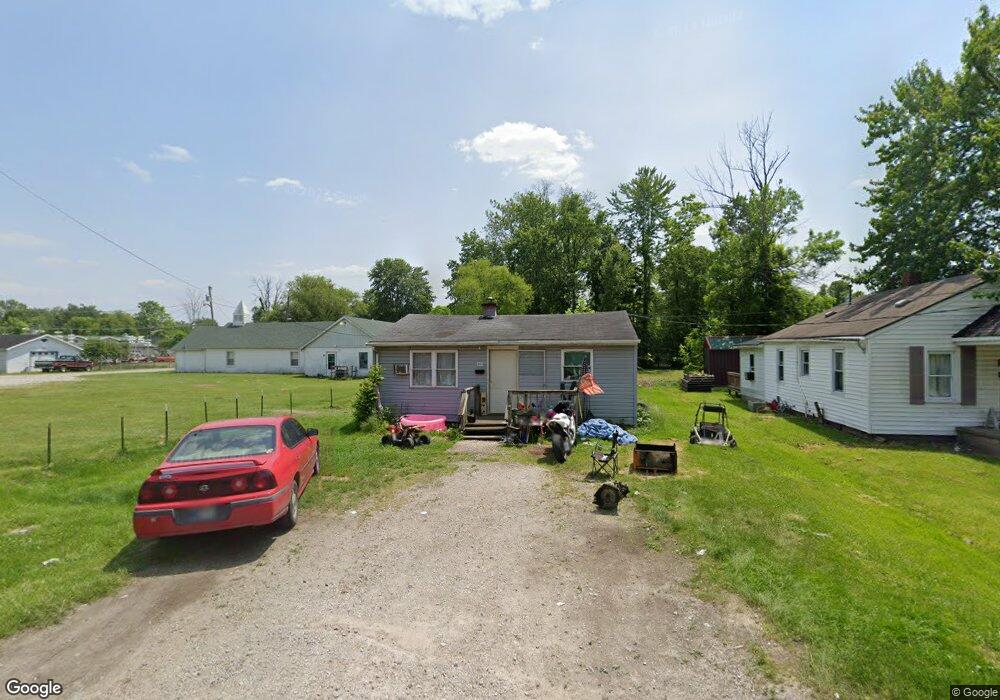
345 W Cross St Austin, IN 47102
Estimated Value: $75,000 - $114,000
2
Beds
1
Bath
672
Sq Ft
$146/Sq Ft
Est. Value
About This Home
This home is located at 345 W Cross St, Austin, IN 47102 and is currently estimated at $98,264, approximately $146 per square foot. 345 W Cross St is a home located in Scott County with nearby schools including Austin Elementary School, Austin Middle School, and Austin High School.
Ownership History
Date
Name
Owned For
Owner Type
Purchase Details
Closed on
Dec 16, 2024
Sold by
Murphy Joey L
Bought by
Z & T Enterprises Llc
Current Estimated Value
Purchase Details
Closed on
Feb 11, 2011
Sold by
Riley Arnold Dale
Bought by
Murphy Tex
Purchase Details
Closed on
Dec 30, 2005
Sold by
Barrett Edna Jewell
Bought by
Riley Arnold Dale and Barrett Edna Jewell
Home Financials for this Owner
Home Financials are based on the most recent Mortgage that was taken out on this home.
Original Mortgage
$34,400
Interest Rate
8.99%
Mortgage Type
Adjustable Rate Mortgage/ARM
Create a Home Valuation Report for This Property
The Home Valuation Report is an in-depth analysis detailing your home's value as well as a comparison with similar homes in the area
Home Values in the Area
Average Home Value in this Area
Purchase History
| Date | Buyer | Sale Price | Title Company |
|---|---|---|---|
| Z & T Enterprises Llc | $110,000 | Houston, Thompson And Lewis | |
| Murphy Tex | $1,563 | None Available | |
| Riley Arnold Dale | -- | None Available |
Source: Public Records
Mortgage History
| Date | Status | Borrower | Loan Amount |
|---|---|---|---|
| Previous Owner | Riley Arnold Dale | $34,400 |
Source: Public Records
Tax History Compared to Growth
Tax History
| Year | Tax Paid | Tax Assessment Tax Assessment Total Assessment is a certain percentage of the fair market value that is determined by local assessors to be the total taxable value of land and additions on the property. | Land | Improvement |
|---|---|---|---|---|
| 2024 | $554 | $22,600 | $6,500 | $16,100 |
| 2023 | $606 | $22,900 | $6,500 | $16,400 |
| 2022 | $510 | $23,100 | $6,500 | $16,600 |
| 2021 | $435 | $21,000 | $6,500 | $14,500 |
| 2020 | $514 | $25,700 | $6,500 | $19,200 |
| 2019 | $510 | $25,500 | $6,500 | $19,000 |
| 2018 | $520 | $26,000 | $6,500 | $19,500 |
| 2017 | $522 | $26,100 | $6,500 | $19,600 |
| 2016 | $518 | $25,900 | $6,500 | $19,400 |
| 2014 | $684 | $34,200 | $7,500 | $26,700 |
| 2013 | $684 | $17,500 | $4,700 | $12,800 |
Source: Public Records
Map
Nearby Homes