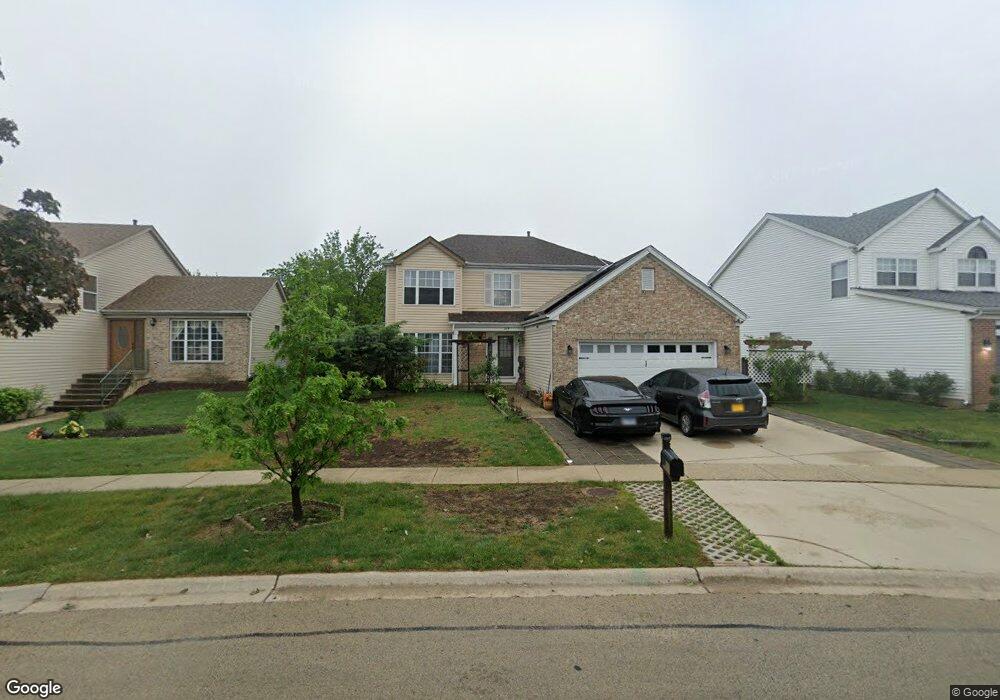
345 Wildflower Way Bolingbrook, IL 60440
East Bolingbrook NeighborhoodEstimated Value: $380,150 - $412,000
4
Beds
3
Baths
2,058
Sq Ft
$192/Sq Ft
Est. Value
About This Home
This home is located at 345 Wildflower Way, Bolingbrook, IL 60440 and is currently estimated at $394,538, approximately $191 per square foot. 345 Wildflower Way is a home located in Will County with nearby schools including Independence Elementary School, Jane Addams Middle School, and Bolingbrook High School.
Ownership History
Date
Name
Owned For
Owner Type
Purchase Details
Closed on
Sep 11, 2020
Sold by
Rifai Ahamed L and Rifai Farzani Gnei
Bought by
Rifai Ahamed L and Rifai Farzani Gnei
Current Estimated Value
Home Financials for this Owner
Home Financials are based on the most recent Mortgage that was taken out on this home.
Original Mortgage
$163,000
Outstanding Balance
$116,064
Interest Rate
2.8%
Mortgage Type
New Conventional
Estimated Equity
$278,474
Purchase Details
Closed on
Jul 22, 2005
Sold by
San Pedro Edwin and San Pedro Jeanette F
Bought by
Rifai Ahamed L
Home Financials for this Owner
Home Financials are based on the most recent Mortgage that was taken out on this home.
Original Mortgage
$201,600
Interest Rate
5.93%
Mortgage Type
Fannie Mae Freddie Mac
Purchase Details
Closed on
Jul 14, 1995
Sold by
Oak Brook Bank
Bought by
Sanpedro Edwin and Sanpedro Jeanette F
Home Financials for this Owner
Home Financials are based on the most recent Mortgage that was taken out on this home.
Original Mortgage
$154,050
Interest Rate
7.64%
Create a Home Valuation Report for This Property
The Home Valuation Report is an in-depth analysis detailing your home's value as well as a comparison with similar homes in the area
Home Values in the Area
Average Home Value in this Area
Purchase History
| Date | Buyer | Sale Price | Title Company |
|---|---|---|---|
| Rifai Ahamed L | -- | First American Title | |
| Rifai Ahamed L | $252,000 | Baird & Warner Title Service | |
| Sanpedro Edwin | $162,500 | -- |
Source: Public Records
Mortgage History
| Date | Status | Borrower | Loan Amount |
|---|---|---|---|
| Open | Rifai Ahamed L | $163,000 | |
| Previous Owner | Rifai Ahamed L | $201,600 | |
| Previous Owner | Sanpedro Edwin | $154,050 |
Source: Public Records
Tax History Compared to Growth
Tax History
| Year | Tax Paid | Tax Assessment Tax Assessment Total Assessment is a certain percentage of the fair market value that is determined by local assessors to be the total taxable value of land and additions on the property. | Land | Improvement |
|---|---|---|---|---|
| 2024 | $9,150 | $107,078 | $19,228 | $87,850 |
| 2023 | $9,150 | $96,345 | $17,301 | $79,044 |
| 2022 | $7,993 | $86,860 | $15,598 | $71,262 |
| 2021 | $7,572 | $81,215 | $14,584 | $66,631 |
| 2020 | $7,338 | $78,544 | $14,104 | $64,440 |
| 2019 | $7,099 | $74,803 | $13,432 | $61,371 |
| 2018 | $6,813 | $71,595 | $12,856 | $58,739 |
| 2017 | $6,484 | $67,863 | $12,186 | $55,677 |
| 2016 | $6,293 | $64,600 | $11,600 | $53,000 |
| 2015 | $6,004 | $61,900 | $11,100 | $50,800 |
| 2014 | $6,004 | $60,100 | $10,800 | $49,300 |
| 2013 | $6,004 | $66,800 | $12,000 | $54,800 |
Source: Public Records
Map
Nearby Homes
- 465 Bloomfield Dr Unit 1
- 528 Alcott Ln
- 321 Whispering Ct Unit 331
- 531 Hillcrest Dr
- 577 Greystone Ln
- 545 Old Stone Rd
- 308 Fieldstone Ct Unit 1
- 210 Mill Stream Dr
- 321 Candlelight Ct Unit 111
- 372 Windsong Ct Unit 4110
- 2V Fernwood Dr
- 5 Fernwood Dr
- 6 Fernwood Dr Unit 6
- 10 Fernwood Dr Unit L
- 164 Galewood Dr
- 14 Fernwood Dr Unit B
- 207 Hampdon Ct
- 15B Fernwood Dr
- 508 Foxborough Trail
- 43 Fernwood Dr Unit D
- 341 Wildflower Way
- 356 Meadowlark Dr
- 353 Wildflower Way Unit 1
- 446 Monarch Ln
- 452 Monarch Ln
- 440 Monarch Ln
- 344 Wildflower Way
- 340 Wildflower Way
- 362 Meadowlark Dr
- 434 Monarch Ln
- 348 Wildflower Way
- 357 Wildflower Way Unit 1
- 422 Monarch Ln Unit 2
- 464 Monarch Ln
- 333 Meadowlark Dr
- 352 Wildflower Way
- 428 Monarch Ln
- 336 Wildflower Way Unit 1
- 368 Meadowlark Dr
- 470 Monarch Ln