Estimated Value: $278,033 - $302,000
3
Beds
2
Baths
1,682
Sq Ft
$174/Sq Ft
Est. Value
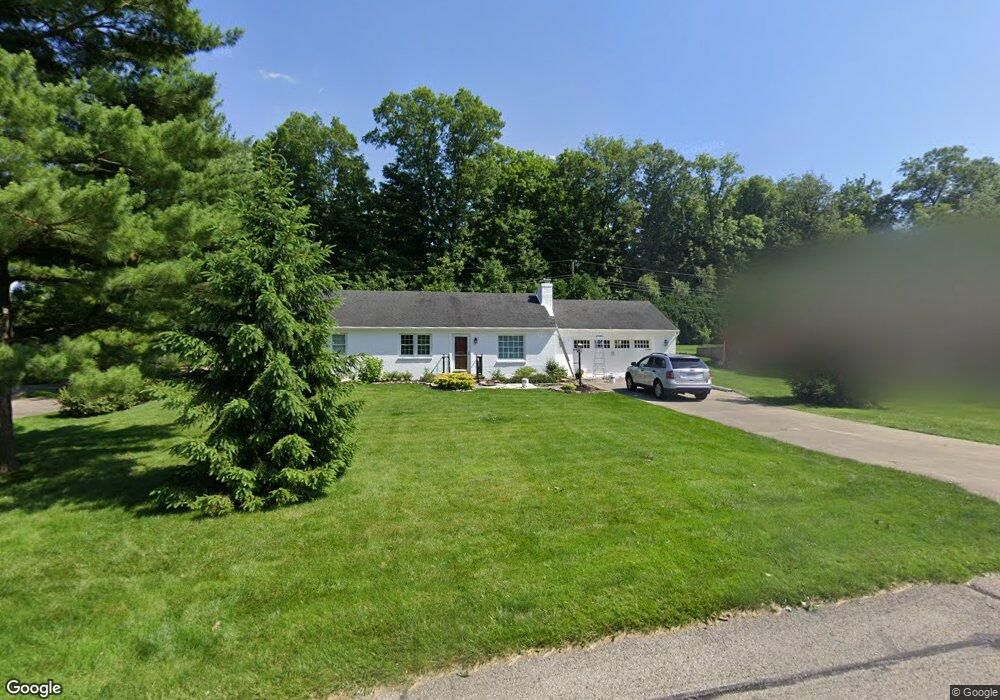
About This Home
This home is located at 345 Winding Trail, Xenia, OH 45385 and is currently estimated at $293,508, approximately $174 per square foot. 345 Winding Trail is a home located in Greene County with nearby schools including Xenia High School, Summit Academy Community School for Alternative Learners - Xenia, and Legacy Christian Academy.
Ownership History
Date
Name
Owned For
Owner Type
Purchase Details
Closed on
May 20, 2014
Sold by
Garfield Theresa N
Bought by
Shirk Lloyd D and Shirk Joann
Current Estimated Value
Purchase Details
Closed on
Mar 18, 2003
Sold by
Mcharg James J and Mcharg Luann M
Bought by
Garfield Theresa N
Home Financials for this Owner
Home Financials are based on the most recent Mortgage that was taken out on this home.
Original Mortgage
$109,000
Outstanding Balance
$47,133
Interest Rate
5.96%
Estimated Equity
$246,375
Purchase Details
Closed on
Jun 3, 1999
Sold by
Horne Floyd D and Horne Lucille S
Bought by
Mcharg James J and Mcharg Luann M
Home Financials for this Owner
Home Financials are based on the most recent Mortgage that was taken out on this home.
Original Mortgage
$68,000
Interest Rate
6.94%
Create a Home Valuation Report for This Property
The Home Valuation Report is an in-depth analysis detailing your home's value as well as a comparison with similar homes in the area
Home Values in the Area
Average Home Value in this Area
Purchase History
| Date | Buyer | Sale Price | Title Company |
|---|---|---|---|
| Shirk Lloyd D | $159,000 | None Available | |
| Garfield Theresa N | $159,000 | -- | |
| Mcharg James J | $126,000 | Home Site Title Agency Inc |
Source: Public Records
Mortgage History
| Date | Status | Borrower | Loan Amount |
|---|---|---|---|
| Open | Garfield Theresa N | $109,000 | |
| Previous Owner | Mcharg James J | $68,000 |
Source: Public Records
Tax History Compared to Growth
Tax History
| Year | Tax Paid | Tax Assessment Tax Assessment Total Assessment is a certain percentage of the fair market value that is determined by local assessors to be the total taxable value of land and additions on the property. | Land | Improvement |
|---|---|---|---|---|
| 2024 | $3,204 | $77,350 | $14,070 | $63,280 |
| 2023 | $3,204 | $77,350 | $14,070 | $63,280 |
| 2022 | $2,572 | $57,940 | $11,730 | $46,210 |
| 2021 | $2,604 | $57,940 | $11,730 | $46,210 |
| 2020 | $2,029 | $57,940 | $11,730 | $46,210 |
| 2019 | $2,029 | $46,230 | $10,560 | $35,670 |
| 2018 | $2,036 | $46,230 | $10,560 | $35,670 |
| 2017 | $1,980 | $46,230 | $10,560 | $35,670 |
| 2016 | $1,908 | $43,290 | $10,560 | $32,730 |
| 2015 | $1,913 | $43,290 | $10,560 | $32,730 |
| 2014 | $2,300 | $43,290 | $10,560 | $32,730 |
Source: Public Records
Map
Nearby Homes
- 965 Oak Dale Dr
- 983 Echo Ct
- 460 Kinsey Rd
- 1359 Eagles Way
- 1311 Eagles Way
- 1764 Highlander Dr
- 15 Sexton Dr
- 2018 Tahoe Dr
- 1171 N Detroit St
- 1038 Frederick Dr
- 656 Eden Roc Dr
- 610 Saxony Dr
- 513 Redbud Ln
- 508 Marshall Dr
- 2094 Malibu Trail
- 2537 Ridge Rd
- 902 N Detroit St
- 878 N Detroit St
- 1815 Promenade Ln
- 1872 Harris Ln
- 393 Woodcrest Ln
- 325 Winding Trail
- 340 Winding Trail
- 373 Woodcrest Ln
- 330 Winding Trail
- 359 Winding Trail
- 315 Winding Trail
- 384 Woodcrest Ln
- 320 Winding Trail
- 357 Woodcrest Ln
- 955 Oak Dale Dr
- 352 Winding Trail
- 943 Oak Dale Dr
- 310 Winding Trail
- 371 Winding Trail
- 377 Woodcrest Ln
- 360 Winding Trail
- 370 Woodcrest Ln
- 941 Helen Ave
- 941 Helen Ave