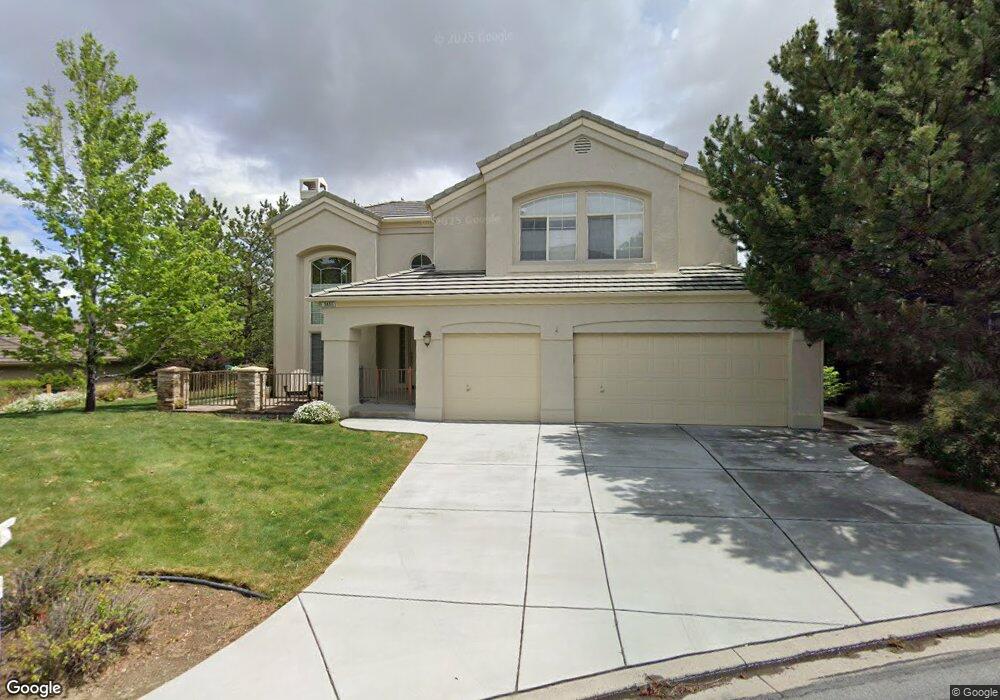
3450 Cranbrook Cir Reno, NV 89519
South Outer Reno NeighborhoodEstimated Value: $904,398 - $1,171,000
4
Beds
3
Baths
2,586
Sq Ft
$404/Sq Ft
Est. Value
About This Home
This home is located at 3450 Cranbrook Cir, Reno, NV 89519 and is currently estimated at $1,045,100, approximately $404 per square foot. 3450 Cranbrook Cir is a home located in Washoe County with nearby schools including Caughlin Ranch Elementary School, Darrell C Swope Middle School, and Reno High School.
Ownership History
Date
Name
Owned For
Owner Type
Purchase Details
Closed on
Feb 22, 2018
Sold by
Woodard Carlton A and Woodard Kathleen M
Bought by
Woodard Carlton A and Woodard Kathleen M
Current Estimated Value
Purchase Details
Closed on
Aug 16, 2016
Sold by
Woodard Carlton A and Woodard Kathleen M
Bought by
Woodard Carloton A and Woodard Kathleen M
Purchase Details
Closed on
Jul 28, 2016
Sold by
Woodard Carlton A and Woodard Kathleen M
Bought by
Woodard Carloton A and Woodard Kathleen M
Purchase Details
Closed on
Mar 22, 1995
Sold by
Brunsonbuilt Construction & Development
Bought by
Woodard Andrew and Woodard Kathleen M
Home Financials for this Owner
Home Financials are based on the most recent Mortgage that was taken out on this home.
Original Mortgage
$160,000
Interest Rate
8.43%
Create a Home Valuation Report for This Property
The Home Valuation Report is an in-depth analysis detailing your home's value as well as a comparison with similar homes in the area
Home Values in the Area
Average Home Value in this Area
Purchase History
| Date | Buyer | Sale Price | Title Company |
|---|---|---|---|
| Woodard Carlton A | -- | None Available | |
| Woodard Carloton A | -- | None Available | |
| Woodard Carloton A | -- | None Available | |
| Woodard Andrew | $315,000 | First American Title Company |
Source: Public Records
Mortgage History
| Date | Status | Borrower | Loan Amount |
|---|---|---|---|
| Previous Owner | Woodard Andrew | $160,000 |
Source: Public Records
Tax History Compared to Growth
Tax History
| Year | Tax Paid | Tax Assessment Tax Assessment Total Assessment is a certain percentage of the fair market value that is determined by local assessors to be the total taxable value of land and additions on the property. | Land | Improvement |
|---|---|---|---|---|
| 2025 | $5,332 | $205,596 | $76,671 | $128,925 |
| 2024 | $5,179 | $202,367 | $71,820 | $130,547 |
| 2023 | $5,179 | $197,061 | $72,954 | $124,107 |
| 2022 | $5,030 | $167,394 | $63,725 | $103,669 |
| 2021 | $4,850 | $164,090 | $60,354 | $103,736 |
| 2020 | $4,706 | $159,412 | $56,606 | $102,806 |
| 2019 | $4,568 | $152,061 | $51,818 | $100,243 |
| 2018 | $4,435 | $133,695 | $35,438 | $98,257 |
| 2017 | $4,304 | $129,680 | $30,965 | $98,715 |
| 2016 | $4,197 | $133,203 | $32,279 | $100,924 |
| 2015 | $4,189 | $128,495 | $26,329 | $102,166 |
| 2014 | $4,067 | $118,544 | $19,152 | $99,392 |
| 2013 | -- | $107,613 | $19,152 | $88,461 |
Source: Public Records
Map
Nearby Homes
- 3911 N Westpoint Dr
- 3332 Deer Ridge Ct
- 1005 Stag Ridge Ct Unit 5
- 1860 Hunter Creek Rd
- 4940 Turning Leaf Way Unit 3
- 3790 Ranch Crest Dr
- 4292 Caughlin Pkwy
- 3744 Ranch Crest Dr Unit 1
- 3678 Brighton Way
- 4732 Cedarhill Ln
- 4120 Flintlock Cir
- 60 Promontory Pointe
- 1720 Hunter Creek Rd Unit 5
- 4999 Foxcreek Trail
- 4283 Water Hole Rd
- 1570 Caughlin Creek Rd
- 2790 W Lakeridge Shores
- 4229 Christy Way
- 4559 Village Green Pkwy
- 4605 Aberfeldy Rd
- 3440 Cranbrook Way Unit 1
- 3460 Cranbrook Cir
- 3430 Cheechako Dr
- 3450 Cheechako Dr
- 3470 Cranbrook Cir
- 4021 Whispering Pine Loop
- 3420 Cheechako Dr
- 3460 Cheechako Dr
- 3480 Cranbrook Cir
- 3421 Cheechako Dr
- 3451 Cheechako Dr
- 3470 Cheechako Dr Unit 1
- 3410 Cheechako Dr
- 3410 Cheechako Dr Unit 108
- 3411 Cheechako Dr
- 4025 Whispering Pine Loop
- 4013 Whispering Pine Loop
- 4020 Whispering Pine Loop
- 4017 Whispering Pine Loop
- 3461 Cheechako Dr