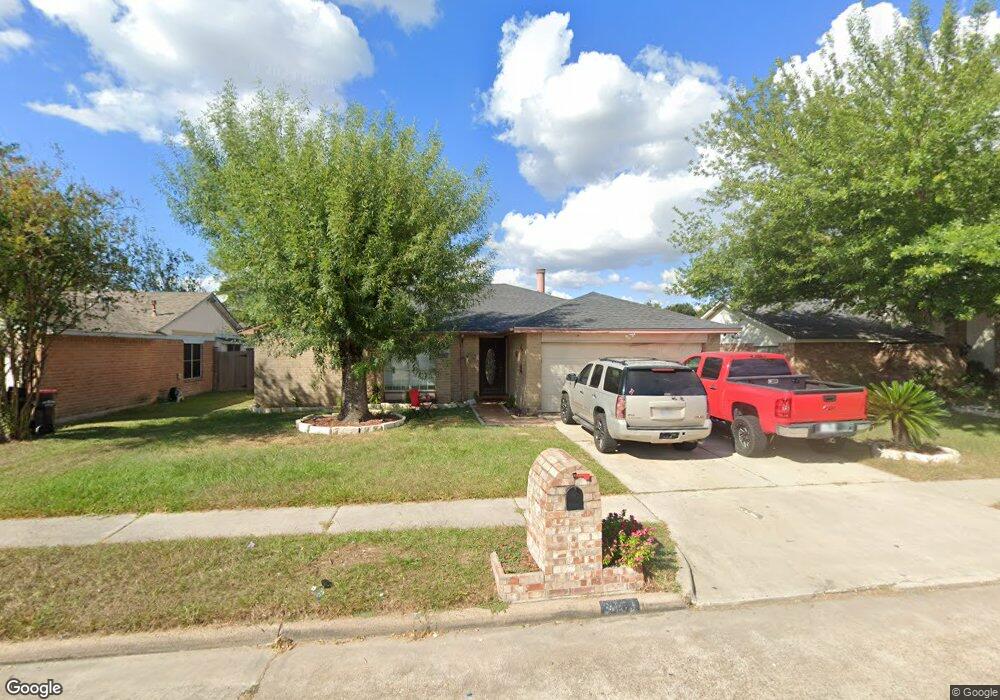
3450 Fountain Spring Dr Houston, TX 77066
Champions NeighborhoodEstimated Value: $184,000 - $218,738
4
Beds
2
Baths
1,465
Sq Ft
$141/Sq Ft
Est. Value
About This Home
This home is located at 3450 Fountain Spring Dr, Houston, TX 77066 and is currently estimated at $206,435, approximately $140 per square foot. 3450 Fountain Spring Dr is a home located in Harris County with nearby schools including Griggs EC/PK/K, Conley Elementary School, and Plummer Middle School.
Ownership History
Date
Name
Owned For
Owner Type
Purchase Details
Closed on
Aug 8, 2016
Sold by
One Pine Viii Llc
Bought by
Gonzalez Vidal P and Hernandez Marycruz
Current Estimated Value
Home Financials for this Owner
Home Financials are based on the most recent Mortgage that was taken out on this home.
Original Mortgage
$108,007
Outstanding Balance
$88,254
Interest Rate
4.25%
Mortgage Type
FHA
Estimated Equity
$118,181
Purchase Details
Closed on
Aug 4, 2015
Sold by
Cruz Anita M and Jpmorgan Chase Bank Na
Bought by
One Pine Viii Llc
Purchase Details
Closed on
Jun 26, 2009
Sold by
Cruz Anita M
Bought by
Jpmorgan Chase Bank
Home Financials for this Owner
Home Financials are based on the most recent Mortgage that was taken out on this home.
Original Mortgage
$91,805
Interest Rate
4.84%
Mortgage Type
FHA
Create a Home Valuation Report for This Property
The Home Valuation Report is an in-depth analysis detailing your home's value as well as a comparison with similar homes in the area
Home Values in the Area
Average Home Value in this Area
Purchase History
| Date | Buyer | Sale Price | Title Company |
|---|---|---|---|
| Gonzalez Vidal P | -- | None Available | |
| One Pine Viii Llc | $72,000 | None Available | |
| Jpmorgan Chase Bank | $91,663 | None Available | |
| Cruz Anita M | -- | First American Title |
Source: Public Records
Mortgage History
| Date | Status | Borrower | Loan Amount |
|---|---|---|---|
| Open | Gonzalez Vidal P | $108,007 | |
| Previous Owner | Cruz Anita M | $91,805 |
Source: Public Records
Tax History Compared to Growth
Tax History
| Year | Tax Paid | Tax Assessment Tax Assessment Total Assessment is a certain percentage of the fair market value that is determined by local assessors to be the total taxable value of land and additions on the property. | Land | Improvement |
|---|---|---|---|---|
| 2025 | $5,322 | $207,176 | $37,808 | $169,368 |
| 2024 | $5,322 | $213,310 | $37,808 | $175,502 |
| 2023 | $5,322 | $234,860 | $37,808 | $197,052 |
| 2022 | $5,430 | $204,440 | $24,874 | $179,566 |
| 2021 | $4,706 | $167,137 | $24,874 | $142,263 |
| 2020 | $4,373 | $142,849 | $24,874 | $117,975 |
| 2019 | $3,821 | $119,824 | $13,266 | $106,558 |
| 2018 | $1,562 | $108,784 | $13,266 | $95,518 |
| 2017 | $3,368 | $108,784 | $13,266 | $95,518 |
| 2016 | $3,368 | $108,784 | $13,266 | $95,518 |
| 2015 | $2,099 | $95,751 | $13,266 | $82,485 |
| 2014 | $2,099 | $66,628 | $13,266 | $53,362 |
Source: Public Records
Map
Nearby Homes
- 14207 Timberhaven Dr
- 14118 Magnolia Springs Dr
- 3407 Sandbrook Dr
- 14003 Valley Grove Dr
- 3240 Brownie Campbell Rd
- 3519 Hombly Rd
- 11322 Yorklyn Dr
- 11335 Chelsea Walk Dr
- 13610 Kaltenbrun Rd
- 3230 Hombly Rd
- 11427 Valarno Dr
- 13518 Kaltenbrun Rd
- 13803 Bearwood Rd
- 2919 Sunwood Dr
- 11009 Panicum Ct
- 6610 Northleaf Dr
- 3446 Cheaney Dr
- 11021 Crenchrus Ct
- 10522 Northview Dr
- 6630 Brownie Campbell Rd
- 3446 Fountain Spring Dr
- 3454 Fountain Spring Dr
- 3483 Garden Grove Dr
- 3487 Garden Grove Dr
- 3479 Garden Grove Dr
- 3442 Fountain Spring Dr
- 3451 Fountain Spring Dr
- 3455 Fountain Spring Dr
- 3447 Fountain Spring Dr
- 3475 Garden Grove Dr
- 3443 Fountain Spring Dr
- 3438 Fountain Spring Dr
- 14119 Timberhaven Dr
- 14123 Timberhaven Dr
- 14115 Timberhaven Dr
- 14127 Timberhaven Dr
- 3471 Garden Grove Dr
- 3439 Fountain Spring Dr
- 14111 Timberhaven Dr
- 3434 Willow Tree Dr