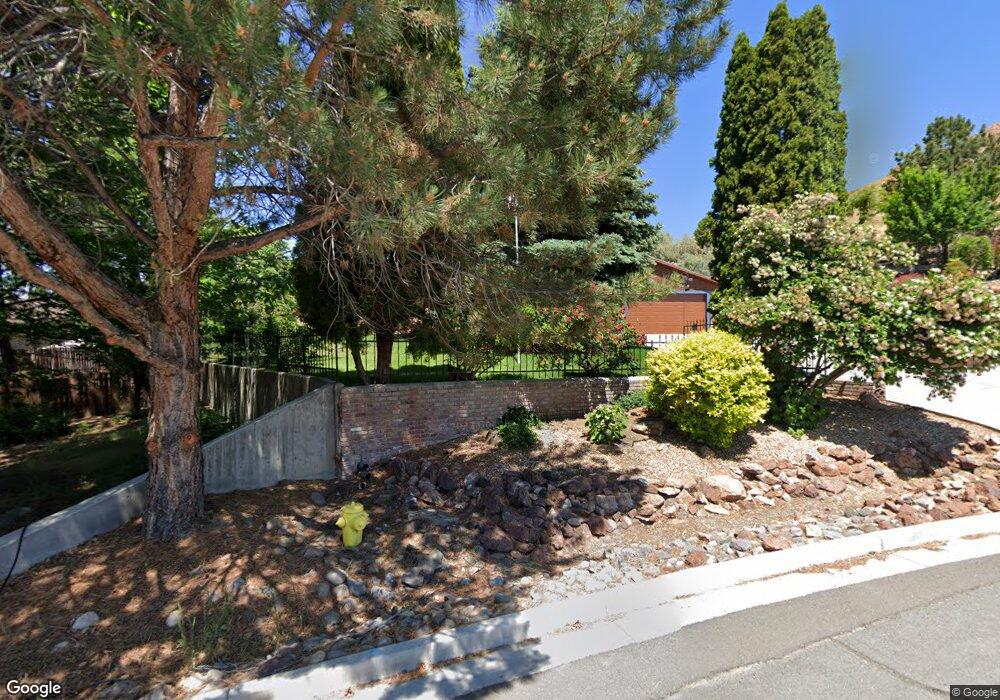
3451 Teglia St Sparks, NV 89431
Reed NeighborhoodEstimated Value: $717,000 - $804,000
3
Beds
3
Baths
2,638
Sq Ft
$287/Sq Ft
Est. Value
About This Home
This home is located at 3451 Teglia St, Sparks, NV 89431 and is currently estimated at $756,473, approximately $286 per square foot. 3451 Teglia St is a home located in Washoe County with nearby schools including Lena Juniper Elementary School, Lou Mendive Middle School, and Edward C Reed High School.
Ownership History
Date
Name
Owned For
Owner Type
Purchase Details
Closed on
Oct 7, 2024
Sold by
George And Janis Dixon Family Trust and Dixon George M
Bought by
George And Janis Dixon Family Trust and Dixon
Current Estimated Value
Purchase Details
Closed on
Dec 23, 1996
Sold by
Madzey Theodore J and Madzey Kerry
Bought by
The Muggs Ltd Partnership
Purchase Details
Closed on
Oct 10, 1995
Sold by
Vandenbosch Robert A and Vandenbosch June
Bought by
Madzey Theodore Joseph and Madzey Kerry Ann
Home Financials for this Owner
Home Financials are based on the most recent Mortgage that was taken out on this home.
Original Mortgage
$30,000
Interest Rate
7.67%
Mortgage Type
Seller Take Back
Create a Home Valuation Report for This Property
The Home Valuation Report is an in-depth analysis detailing your home's value as well as a comparison with similar homes in the area
Home Values in the Area
Average Home Value in this Area
Purchase History
| Date | Buyer | Sale Price | Title Company |
|---|---|---|---|
| George And Janis Dixon Family Trust | -- | None Listed On Document | |
| The Muggs Ltd Partnership | -- | -- | |
| Madzey Theodore J | -- | -- | |
| Madzey Theodore Joseph | $45,000 | First American Title Co |
Source: Public Records
Mortgage History
| Date | Status | Borrower | Loan Amount |
|---|---|---|---|
| Previous Owner | Madzey Theodore Joseph | $30,000 |
Source: Public Records
Tax History Compared to Growth
Tax History
| Year | Tax Paid | Tax Assessment Tax Assessment Total Assessment is a certain percentage of the fair market value that is determined by local assessors to be the total taxable value of land and additions on the property. | Land | Improvement |
|---|---|---|---|---|
| 2025 | $4,061 | $148,217 | $54,250 | $93,967 |
| 2024 | $4,061 | $146,622 | $50,750 | $95,872 |
| 2023 | $3,944 | $139,233 | $47,250 | $91,983 |
| 2022 | $3,830 | $124,724 | $47,250 | $77,474 |
| 2021 | $3,719 | $106,132 | $27,930 | $78,202 |
| 2020 | $3,608 | $107,156 | $27,930 | $79,226 |
| 2019 | $3,505 | $105,418 | $26,600 | $78,818 |
| 2018 | $3,403 | $99,164 | $19,950 | $79,214 |
| 2017 | $3,304 | $100,098 | $19,950 | $80,148 |
| 2016 | $3,222 | $101,917 | $19,950 | $81,967 |
| 2015 | $821 | $99,539 | $16,345 | $83,194 |
| 2014 | $3,129 | $84,952 | $10,675 | $74,277 |
| 2013 | -- | $84,914 | $11,515 | $73,399 |
Source: Public Records
Map
Nearby Homes
- 3595 Rocky Ridge Ct
- 3200 Bristle Branch Dr
- 3198 Bristle Branch Dr
- 3188 Bristle Branch Dr
- 3104 Sandy St
- 3167 Bristle Branch Dr
- 930 Spanish Springs Rd
- 3245 Elaine Way
- 3071 Meadowlands Dr
- 120 E Lenwood Dr
- 3545 4th St
- 1031 Vintage Hills Pkwy
- 1069 Palmwood Dr
- 3602 Oakridge Dr
- 3607 Keogh Dr
- 3465 Dawn Cir
- 745 Glen Vista Dr
- 1128 Bradley Square
- 1029 Baywood Dr Unit D
- 1035 Baywood Dr Unit D
- 612 Northwood Dr
- 3421 Teglia St
- 622 Northwood Dr
- 3420 Teglia St
- 410 E Queen Way
- 3401 Teglia St
- 3450 Crabapple Hollow
- 3430 Crabapple Hollow
- 400 E Queen Way
- 631 Northwood Dr
- 3410 Teglia St
- 632 Northwood Dr
- 3410 Crabapple Hollow
- 640 E Queen Way
- 641 Northwood Dr
- 443 E Queen Way
- 642 Northwood Dr
- 463 E Queen Way
- 3445 Crabapple Hollow
- 423 E Queen Way