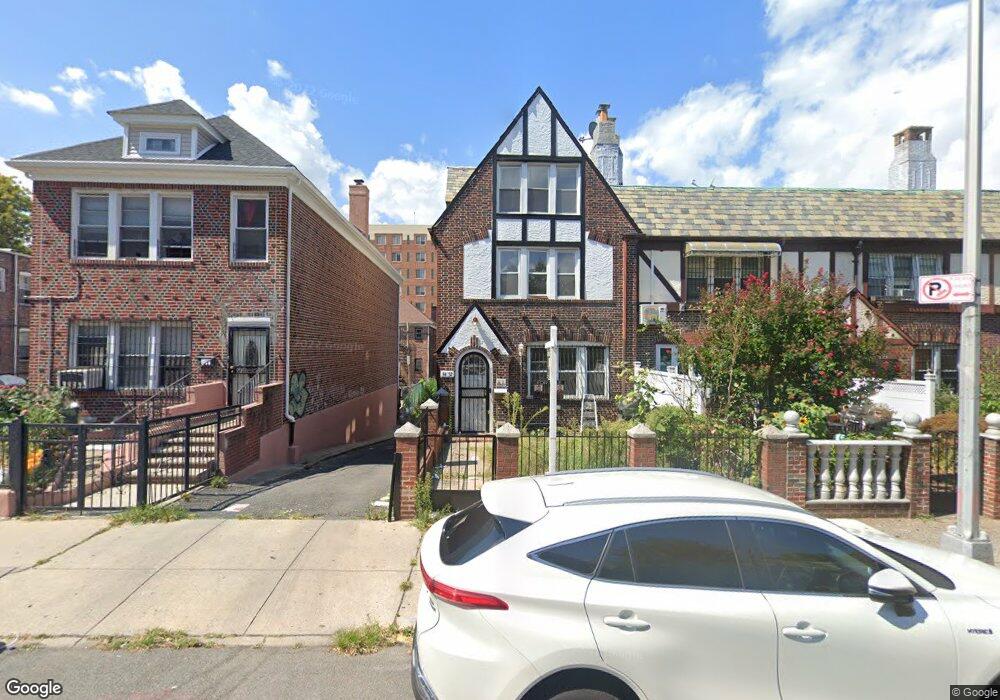
3452 72nd St Jackson Heights, NY 11372
Jackson Heights NeighborhoodEstimated Value: $1,099,000 - $1,239,398
--
Bed
--
Bath
1,740
Sq Ft
$684/Sq Ft
Est. Value
About This Home
This home is located at 3452 72nd St, Jackson Heights, NY 11372 and is currently estimated at $1,189,600, approximately $683 per square foot. 3452 72nd St is a home located in Queens County with nearby schools including P.S. 69 Jackson Heights, I.S. 230, and William Cullen Bryant High School.
Ownership History
Date
Name
Owned For
Owner Type
Purchase Details
Closed on
Mar 1, 2024
Sold by
34-52 72Nd St Inc
Bought by
Ahmed Faysal and Ahmed Feroz
Current Estimated Value
Home Financials for this Owner
Home Financials are based on the most recent Mortgage that was taken out on this home.
Original Mortgage
$700,000
Outstanding Balance
$687,136
Interest Rate
6.69%
Mortgage Type
Purchase Money Mortgage
Estimated Equity
$502,464
Purchase Details
Closed on
Apr 29, 2022
Sold by
Rohrer Terry and Suarez Martha
Bought by
34-52 72Nd St Inc
Home Financials for this Owner
Home Financials are based on the most recent Mortgage that was taken out on this home.
Original Mortgage
$825,000
Interest Rate
4.72%
Mortgage Type
Purchase Money Mortgage
Purchase Details
Closed on
May 24, 2006
Sold by
Garcia Romantico Daisy and Garcia Adolfo
Bought by
Rohrer Terry and Suarez Martha
Create a Home Valuation Report for This Property
The Home Valuation Report is an in-depth analysis detailing your home's value as well as a comparison with similar homes in the area
Home Values in the Area
Average Home Value in this Area
Purchase History
| Date | Buyer | Sale Price | Title Company |
|---|---|---|---|
| Ahmed Faysal | $1,220,000 | -- | |
| Ahmed Faysal | $1,220,000 | -- | |
| 34-52 72Nd St Inc | $950,000 | -- | |
| 34-52 72Nd St Inc | $950,000 | -- | |
| Rohrer Terry | -- | -- | |
| Rohrer Terry | -- | -- |
Source: Public Records
Mortgage History
| Date | Status | Borrower | Loan Amount |
|---|---|---|---|
| Open | Ahmed Faysal | $700,000 | |
| Closed | Ahmed Faysal | $700,000 | |
| Previous Owner | 34-52 72Nd St Inc | $825,000 | |
| Closed | Rohrer Terry | $0 |
Source: Public Records
Tax History Compared to Growth
Tax History
| Year | Tax Paid | Tax Assessment Tax Assessment Total Assessment is a certain percentage of the fair market value that is determined by local assessors to be the total taxable value of land and additions on the property. | Land | Improvement |
|---|---|---|---|---|
| 2025 | $9,059 | $47,807 | $9,454 | $38,353 |
| 2024 | $9,059 | $45,101 | $9,818 | $35,283 |
| 2023 | $8,602 | $42,830 | $9,682 | $33,148 |
| 2022 | $8,067 | $63,840 | $13,740 | $50,100 |
| 2021 | $8,483 | $67,440 | $13,740 | $53,700 |
| 2020 | $8,433 | $70,800 | $13,740 | $57,060 |
| 2019 | $7,862 | $71,100 | $13,740 | $57,360 |
| 2018 | $7,276 | $35,692 | $7,928 | $27,764 |
| 2017 | $6,864 | $33,674 | $8,967 | $24,707 |
| 2016 | $6,715 | $33,674 | $8,967 | $24,707 |
| 2015 | $3,832 | $33,199 | $13,731 | $19,468 |
| 2014 | $3,832 | $31,320 | $14,220 | $17,100 |
Source: Public Records
Map
Nearby Homes
- 35-05 72nd St Unit 3G
- 35-05 72nd St Unit 2C
- 35-05 72nd St Unit 2E
- 35-05 72nd St Unit 4E
- 35-20 73rd St Unit 6R
- 3530 73rd St Unit 6A
- 35-30 73rd St Unit 6-A
- 35-30 73rd St Unit 1 F
- 73-12 35th Ave Unit C24
- 3550 73rd St
- 35-20 Leverich St Unit 209
- 35-20 Leverich St Unit 524
- 35-20 Leverich St Unit A201
- 35-20 Leverich St Unit B226
- 35-20 Leverich St Unit A504
- 3520 Leverich St Unit 212
- 35-38 75th St Unit 2F
- 35-38 75th St Unit 4C
- 72-15 37th Ave Unit 4B
- 72-15 37th Ave Unit 3H