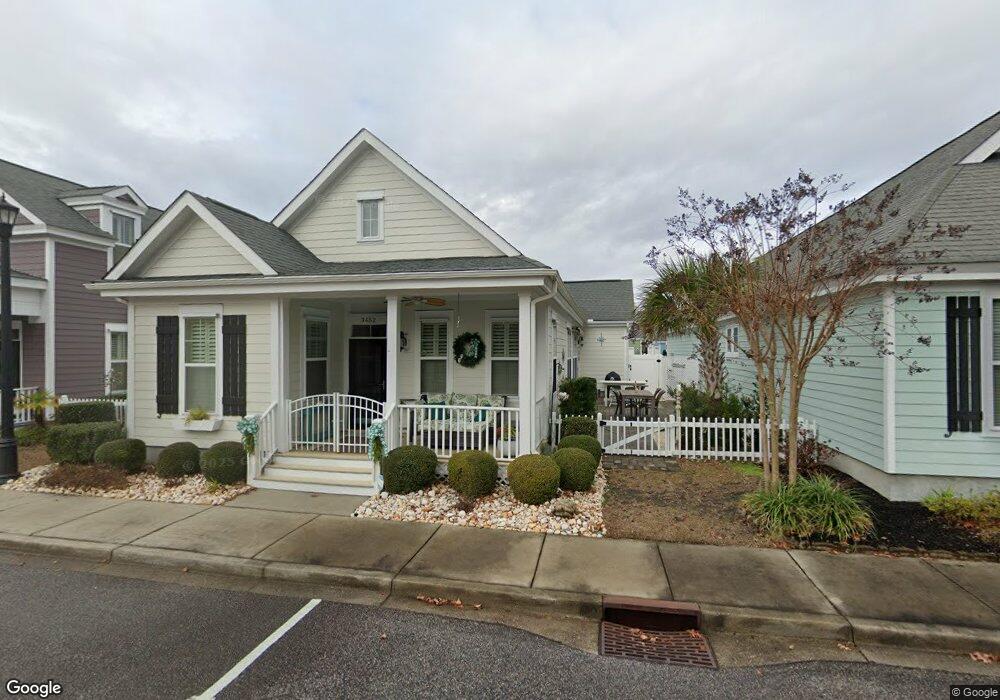
3452 Baldwin Ln Unit Lexington Myrtle Beach, SC 29577
Market Commons NeighborhoodEstimated Value: $493,000 - $596,000
3
Beds
3
Baths
1,971
Sq Ft
$283/Sq Ft
Est. Value
About This Home
This home is located at 3452 Baldwin Ln Unit Lexington, Myrtle Beach, SC 29577 and is currently estimated at $558,147, approximately $283 per square foot. 3452 Baldwin Ln Unit Lexington is a home located in Horry County with nearby schools including Myrtle Beach Child Development Center, Myrtle Beach Primary School, and Myrtle Beach Elementary School.
Ownership History
Date
Name
Owned For
Owner Type
Purchase Details
Closed on
Jan 17, 2020
Sold by
Player Bridget E
Bought by
Blevins Randall S and Blevins Nanette
Current Estimated Value
Home Financials for this Owner
Home Financials are based on the most recent Mortgage that was taken out on this home.
Original Mortgage
$337,590
Outstanding Balance
$298,848
Interest Rate
3.7%
Mortgage Type
VA
Estimated Equity
$259,299
Purchase Details
Closed on
Jan 5, 2017
Sold by
Coulter Carter Terrence Ray and Coulter Carter Tonya
Bought by
Player Bridget E
Home Financials for this Owner
Home Financials are based on the most recent Mortgage that was taken out on this home.
Original Mortgage
$247
Interest Rate
4.13%
Mortgage Type
New Conventional
Purchase Details
Closed on
May 31, 2016
Sold by
Carter Terrence R
Bought by
Carter Terrence R and Carter Tonya C
Home Financials for this Owner
Home Financials are based on the most recent Mortgage that was taken out on this home.
Original Mortgage
$257,732
Interest Rate
3.75%
Mortgage Type
FHA
Purchase Details
Closed on
Apr 12, 2012
Sold by
Dock Street Communities
Bought by
Carter Terrence R
Create a Home Valuation Report for This Property
The Home Valuation Report is an in-depth analysis detailing your home's value as well as a comparison with similar homes in the area
Home Values in the Area
Average Home Value in this Area
Purchase History
| Date | Buyer | Sale Price | Title Company |
|---|---|---|---|
| Blevins Randall S | $330,000 | -- | |
| Player Bridget E | $319,900 | None Available | |
| Carter Terrence R | -- | -- | |
| Carter Terrence R | $240,000 | -- |
Source: Public Records
Mortgage History
| Date | Status | Borrower | Loan Amount |
|---|---|---|---|
| Open | Blevins Randall S | $337,590 | |
| Previous Owner | Player Bridget E | $247 | |
| Previous Owner | Carter Terrence R | $257,732 |
Source: Public Records
Tax History Compared to Growth
Tax History
| Year | Tax Paid | Tax Assessment Tax Assessment Total Assessment is a certain percentage of the fair market value that is determined by local assessors to be the total taxable value of land and additions on the property. | Land | Improvement |
|---|---|---|---|---|
| 2024 | $1,354 | $18,657 | $5,061 | $13,596 |
| 2023 | $1,354 | $13,200 | $3,052 | $10,148 |
| 2021 | $1,216 | $13,200 | $3,052 | $10,148 |
| 2020 | $1,003 | $12,604 | $3,052 | $9,552 |
| 2019 | $965 | $12,604 | $3,052 | $9,552 |
| 2018 | $0 | $12,539 | $1,967 | $10,572 |
| 2017 | $836 | $10,935 | $1,967 | $8,968 |
| 2016 | -- | $10,935 | $1,967 | $8,968 |
| 2015 | $828 | $10,936 | $1,968 | $8,968 |
| 2014 | $746 | $10,936 | $1,968 | $8,968 |
Source: Public Records
Map
Nearby Homes
- 3448 Baldwin Ln
- 3452 Baldwin Ln
- 750 Howard Ave Unit E
- 754 Murray Ave
- 3385 Pampas Dr
- 3400 Pampas Dr
- 830 Howard Ave Unit D
- 736 Satterwhite Way
- 3523 Chestnut Dr
- 813 Pancho St
- 763 Moen Place Unit 763-B
- 718 Shine Ave
- 3526 Evergreen Way Unit 3526
- 1411 Peterson St
- 3530 Evergreen Way
- 804 Shine Ave
- 780 Gabreski Ln Unit A-2
- 800 Curtis Brown Ln
- 2794 Howard Ave Unit A
- 853 Johnson Ave
- 3456 Baldwin Ln Unit Verdier
- 3456 Baldwin Ln
- 3444 Baldwin Ln
- 910 Mallard Lake Dr Unit King Street Cottage
- 910 Mallard Lake Dr
- 655 Murray Ave
- 916 Mallard Lake Dr
- 3440 Baldwin Ln
- 661 Murray Ave Unit Colleton II
- 661 Murray Ave Unit Colleton 2
- 661 Murray Ave
- 922 Mallard Lake Dr
- 667 Murray Ave
- 928 Mallard Lake Dr
- R12 Lot 35 Branch St
- Lot 57 Branch St Unit Quarters
- Lot 54 Branch St Unit Quarters
- Lot 56 Branch St Unit Colleton
- Lot 55 Branch St Unit Quarters
- R12 Lot 37 Baldwin Ln