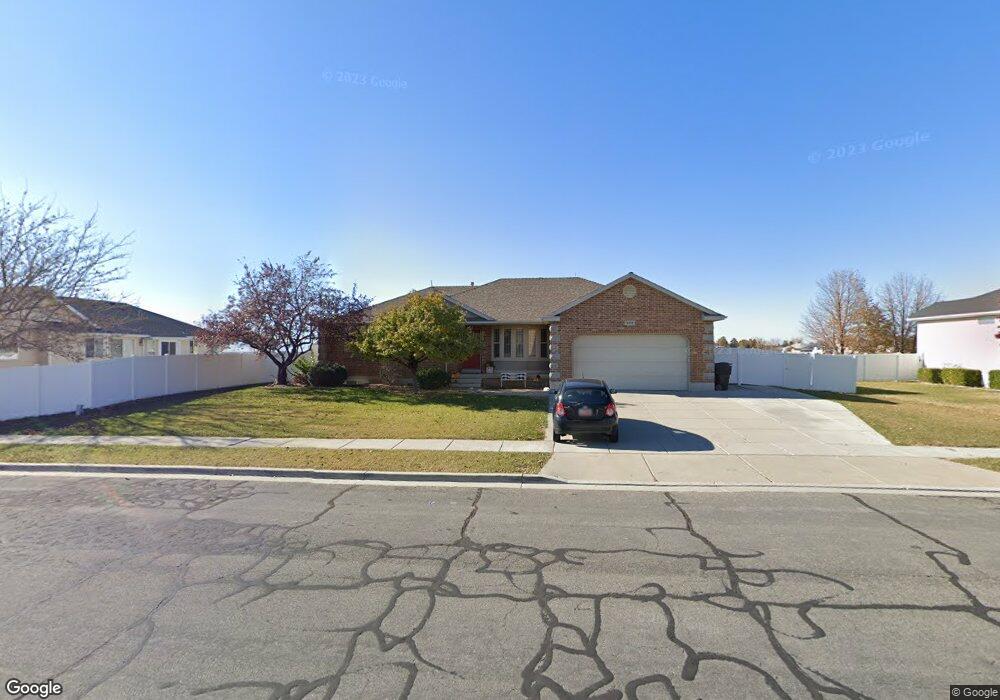
3452 S 575 W Syracuse, UT 84075
Estimated Value: $619,000 - $677,000
5
Beds
3
Baths
3,436
Sq Ft
$188/Sq Ft
Est. Value
About This Home
This home is located at 3452 S 575 W, Syracuse, UT 84075 and is currently estimated at $647,235, approximately $188 per square foot. 3452 S 575 W is a home located in Davis County with nearby schools including Legacy Junior High School, Clearfield High School, and North Davis Preparatory Academy.
Ownership History
Date
Name
Owned For
Owner Type
Purchase Details
Closed on
Aug 21, 2017
Sold by
Warden Megan P
Bought by
Wall Tyson and Wall Ashlee
Current Estimated Value
Home Financials for this Owner
Home Financials are based on the most recent Mortgage that was taken out on this home.
Original Mortgage
$260,000
Outstanding Balance
$216,715
Interest Rate
3.92%
Mortgage Type
New Conventional
Estimated Equity
$430,520
Purchase Details
Closed on
Aug 13, 2005
Sold by
Robinson Megan P
Bought by
Robinson Megan P
Purchase Details
Closed on
Jul 18, 2003
Sold by
Lessig Gary
Bought by
Robinson Timothy J
Home Financials for this Owner
Home Financials are based on the most recent Mortgage that was taken out on this home.
Original Mortgage
$199,500
Interest Rate
4%
Mortgage Type
Purchase Money Mortgage
Purchase Details
Closed on
Sep 6, 2002
Sold by
Niederhauser Clare B and Staples Dee R
Bought by
Lessig Gary
Create a Home Valuation Report for This Property
The Home Valuation Report is an in-depth analysis detailing your home's value as well as a comparison with similar homes in the area
Home Values in the Area
Average Home Value in this Area
Purchase History
| Date | Buyer | Sale Price | Title Company |
|---|---|---|---|
| Wall Tyson | -- | Backman Title | |
| Robinson Megan P | -- | -- | |
| Robinson Timothy J | -- | Bonneville Title Company Inc | |
| Lessig Gary | -- | Bonneville Title Company Inc |
Source: Public Records
Mortgage History
| Date | Status | Borrower | Loan Amount |
|---|---|---|---|
| Open | Wall Tyson | $260,000 | |
| Previous Owner | Robinson Timothy J | $199,500 |
Source: Public Records
Tax History Compared to Growth
Tax History
| Year | Tax Paid | Tax Assessment Tax Assessment Total Assessment is a certain percentage of the fair market value that is determined by local assessors to be the total taxable value of land and additions on the property. | Land | Improvement |
|---|---|---|---|---|
| 2025 | $3,267 | $315,150 | $123,707 | $191,443 |
| 2024 | $3,273 | $317,900 | $101,129 | $216,771 |
| 2023 | $3,164 | $560,000 | $140,978 | $419,022 |
| 2022 | $3,384 | $328,350 | $81,315 | $247,035 |
| 2021 | $2,889 | $434,000 | $120,031 | $313,969 |
| 2020 | $2,599 | $378,000 | $105,154 | $272,846 |
| 2019 | $2,515 | $361,000 | $102,057 | $258,943 |
| 2018 | $2,337 | $333,000 | $98,955 | $234,045 |
| 2016 | $1,932 | $144,375 | $38,008 | $106,367 |
| 2015 | $2,015 | $143,385 | $38,008 | $105,377 |
| 2014 | $1,853 | $134,380 | $38,008 | $96,372 |
| 2013 | -- | $137,950 | $32,571 | $105,379 |
Source: Public Records
Map
Nearby Homes
- 567 W 3575 S
- 3169 S 550 W
- 454 N 3550 W
- 967 W Yamada Ct
- 101 S 3600 W
- 3583 W 200 S
- 1139 W 3150 S
- 3535 W Overlook Dr
- 3263 W 850 N
- 803 W 2800 S
- 3528 S Finch St
- 697 N 3275 W
- 245 S Summer Breeze Ln
- 3067 S Old Emigrant Rd Unit B
- 2784 S 1720 W Unit F
- 3637 S Creek Side Ln
- 2958 S 1320 W
- 2766 S 1200 W
- 3391 W 1125 N
- 475 W 2400 S