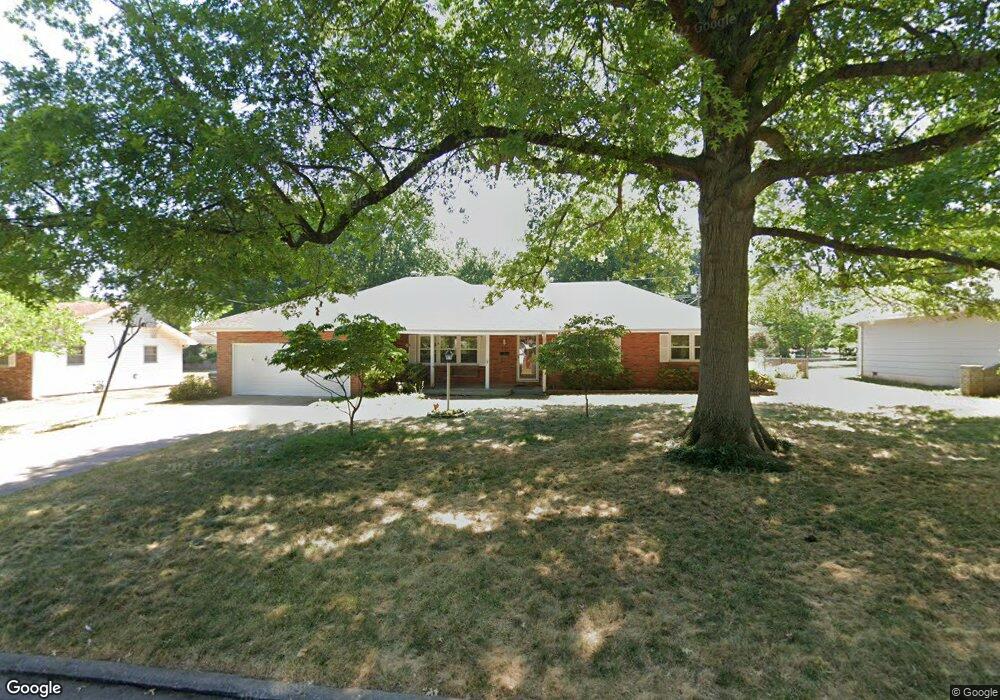
3452 S Pinehurst Ct Springfield, MO 65807
Parkcrest NeighborhoodEstimated Value: $266,773 - $284,000
3
Beds
2
Baths
1,910
Sq Ft
$145/Sq Ft
Est. Value
About This Home
This home is located at 3452 S Pinehurst Ct, Springfield, MO 65807 and is currently estimated at $277,193, approximately $145 per square foot. 3452 S Pinehurst Ct is a home located in Greene County with nearby schools including Horace Mann Elementary School, Carver Middle School, and Kickapoo High School.
Ownership History
Date
Name
Owned For
Owner Type
Purchase Details
Closed on
Apr 8, 2025
Sold by
Bickers John Joseph
Bought by
John Bickers Revocable Trust and Bickers
Current Estimated Value
Purchase Details
Closed on
Apr 1, 2017
Sold by
Foskett Karla Dawn
Bought by
Bicker John Joseph
Purchase Details
Closed on
Jul 28, 2007
Sold by
Bickers Jodell Manley
Bought by
Bickers John Joseph
Home Financials for this Owner
Home Financials are based on the most recent Mortgage that was taken out on this home.
Original Mortgage
$148,000
Interest Rate
6.37%
Mortgage Type
Future Advance Clause Open End Mortgage
Purchase Details
Closed on
Jun 21, 2007
Sold by
Johnson Allan and Johnson Donna
Bought by
Bickers John J
Home Financials for this Owner
Home Financials are based on the most recent Mortgage that was taken out on this home.
Original Mortgage
$148,000
Interest Rate
6.37%
Mortgage Type
Future Advance Clause Open End Mortgage
Create a Home Valuation Report for This Property
The Home Valuation Report is an in-depth analysis detailing your home's value as well as a comparison with similar homes in the area
Home Values in the Area
Average Home Value in this Area
Purchase History
| Date | Buyer | Sale Price | Title Company |
|---|---|---|---|
| John Bickers Revocable Trust | -- | None Listed On Document | |
| John Bickers Revocable Trust | -- | None Listed On Document | |
| Bicker John Joseph | -- | None Available | |
| Bickers John Joseph | -- | None Available | |
| Bickers John J | -- | None Available |
Source: Public Records
Mortgage History
| Date | Status | Borrower | Loan Amount |
|---|---|---|---|
| Previous Owner | Bickers John J | $148,000 |
Source: Public Records
Tax History
| Year | Tax Paid | Tax Assessment Tax Assessment Total Assessment is a certain percentage of the fair market value that is determined by local assessors to be the total taxable value of land and additions on the property. | Land | Improvement |
|---|---|---|---|---|
| 2025 | $1,804 | $36,210 | $6,840 | $29,370 |
| 2024 | $1,739 | $32,410 | $5,700 | $26,710 |
| 2023 | $1,729 | $32,410 | $5,700 | $26,710 |
| 2022 | $1,526 | $27,950 | $5,700 | $22,250 |
| 2021 | $1,526 | $27,950 | $5,700 | $22,250 |
| 2020 | $1,501 | $26,280 | $5,700 | $20,580 |
| 2019 | $1,459 | $26,280 | $5,700 | $20,580 |
| 2018 | $1,226 | $22,100 | $5,700 | $16,400 |
| 2017 | $1,214 | $21,170 | $5,700 | $15,470 |
| 2016 | $1,160 | $21,170 | $5,700 | $15,470 |
| 2015 | $1,150 | $21,170 | $5,700 | $15,470 |
| 2014 | $1,158 | $21,170 | $5,700 | $15,470 |
Source: Public Records
Map
Nearby Homes
- 660 W Village St
- 3539 S Broadway Ave
- 842 W Deerfield St
- 3243 S Ferguson Ave
- 3637 S Fort Ave
- 3237 S Ferguson Ave
- 1313 W Primrose St
- 1320 Walnut Lawn Ct
- 1233 W Highland St
- 3301 South Ave
- 3314 South Ave
- 3656 S Westwood Ave
- 3204 S Nettleton Ave
- 3047 S Ferguson Ave
- 1515 W Swan St
- 1811 W Village Ln
- 3158 S Roanoke Ave
- 3925 S Jefferson Ave Unit 45
- 3226 S Benton Ave
- 1658 W Riverside St
- 3462 S Pinehurst Ct
- 3453 S Dayton Ave
- 3443 S Dayton Ave
- 3463 S Dayton Ave
- 3451 S Pinehurst Ct
- 3432 S Pinehurst Ct
- 3441 S Pinehurst Ct
- 3461 S Pinehurst Ct
- 3433 S Dayton Ave
- 3431 S Pinehurst Ct
- 650 W Village St
- 670 W Village St
- 3422 S Pinehurst Ct
- 640 W Village St
- 3450 S Broadway Ave
- 3423 S Dayton Ave
- 3454 S Dayton Ave
- 3464 S Dayton Ave
- 3440 S Broadway Ave
- 3460 S Broadway Ave
Your Personal Tour Guide
Ask me questions while you tour the home.