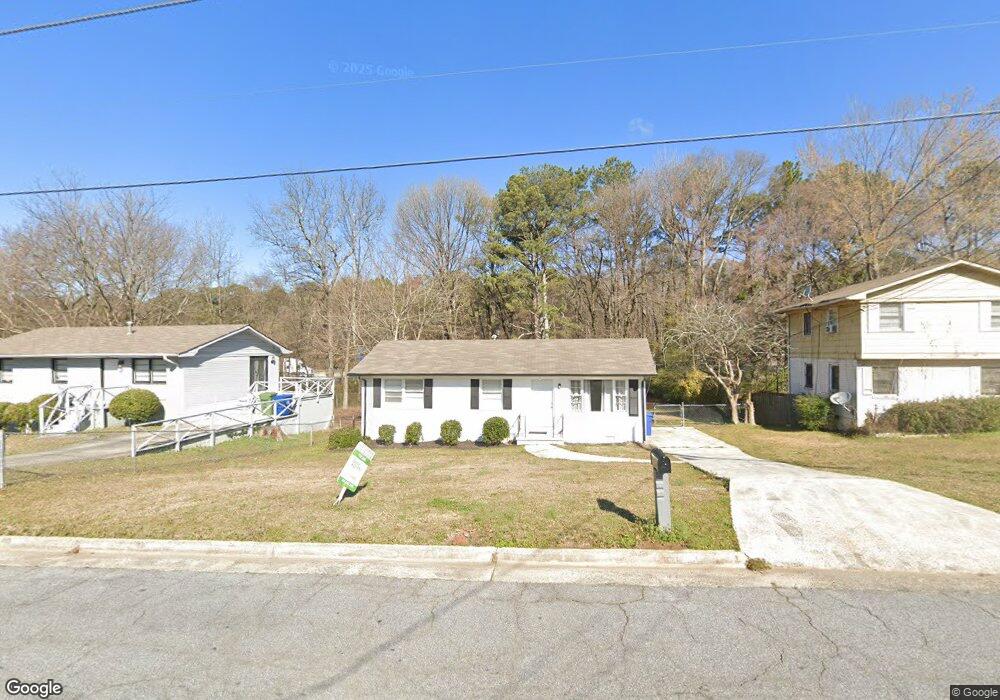
3453 Eisenhower Cir SE Unit 4 Atlanta, GA 30354
South River Gardens NeighborhoodEstimated Value: $154,000 - $171,022
3
Beds
1
Bath
1,000
Sq Ft
$160/Sq Ft
Est. Value
About This Home
This home is located at 3453 Eisenhower Cir SE Unit 4, Atlanta, GA 30354 and is currently estimated at $160,256, approximately $160 per square foot. 3453 Eisenhower Cir SE Unit 4 is a home located in Fulton County with nearby schools including Heritage Academy Elementary School, Long Middle School, and South Atlanta High School.
Ownership History
Date
Name
Owned For
Owner Type
Purchase Details
Closed on
Jul 29, 2025
Sold by
Caverron Holdings Llc
Bought by
Griffin Shamba
Current Estimated Value
Home Financials for this Owner
Home Financials are based on the most recent Mortgage that was taken out on this home.
Original Mortgage
$152,192
Outstanding Balance
$151,925
Interest Rate
6.67%
Mortgage Type
New Conventional
Estimated Equity
$8,331
Purchase Details
Closed on
Dec 18, 2023
Sold by
Vb One Llc
Bought by
Caverron Holdings Llc
Purchase Details
Closed on
May 12, 2022
Sold by
Mozek Greg
Bought by
Vb One Llc
Purchase Details
Closed on
Mar 10, 2016
Sold by
Davis Hiram B
Bought by
Mozeke Greg
Purchase Details
Closed on
Feb 3, 2003
Sold by
Davis Hiram B and Davis Anna P
Bought by
Davis Hiram B and Davis Anna P
Create a Home Valuation Report for This Property
The Home Valuation Report is an in-depth analysis detailing your home's value as well as a comparison with similar homes in the area
Home Values in the Area
Average Home Value in this Area
Purchase History
| Date | Buyer | Sale Price | Title Company |
|---|---|---|---|
| Griffin Shamba | $155,000 | -- | |
| Caverron Holdings Llc | $150,000 | -- | |
| Vb One Llc | $185,000 | -- | |
| Mozeke Greg | $47,000 | -- | |
| Davis Hiram B | -- | -- |
Source: Public Records
Mortgage History
| Date | Status | Borrower | Loan Amount |
|---|---|---|---|
| Open | Griffin Shamba | $152,192 |
Source: Public Records
Tax History Compared to Growth
Tax History
| Year | Tax Paid | Tax Assessment Tax Assessment Total Assessment is a certain percentage of the fair market value that is determined by local assessors to be the total taxable value of land and additions on the property. | Land | Improvement |
|---|---|---|---|---|
| 2025 | $1,914 | $65,280 | $17,840 | $47,440 |
| 2023 | $1,914 | $49,640 | $14,840 | $34,800 |
| 2022 | $1,300 | $32,120 | $3,600 | $28,520 |
| 2021 | $1,262 | $31,160 | $3,480 | $27,680 |
| 2020 | $1,262 | $30,800 | $3,440 | $27,360 |
| 2019 | $490 | $13,520 | $2,080 | $11,440 |
| 2018 | $545 | $13,160 | $2,000 | $11,160 |
| 2017 | $214 | $4,960 | $1,040 | $3,920 |
| 2016 | $215 | $4,960 | $1,040 | $3,920 |
| 2015 | $702 | $4,960 | $1,040 | $3,920 |
| 2014 | $191 | $4,960 | $1,040 | $3,920 |
Source: Public Records
Map
Nearby Homes
- 3523 Garfield Way SE
- 1026 Eisenhower Ct SE
- 3370 Eisenhower Cir SE
- 3505 Oakshire Way SE
- 3571 Oakshire Way SE
- 3534 Oakshire Way SE
- 1054 MacKets Ct SE
- 1021 Litherland Ct SE
- 3688 Chevington Ct SE
- 996 Forest Valley Dr SE
- 1034 Forest Valley Dr SE
- 667 Tara Cir SE
- 3267 Donnebrook Ln SE
- 1220 Erica Way SE
- 3851 Bonnie Ln SE
- 3881 Bonnie Ln SE
- 0 Jonesboro Rd Unit 20166054
- 629 Sandys Ln SE
- 3453 Eisenhower Cir SE Unit 3453
- 3459 Eisenhower Cir SE
- 3445 Eisenhower Cir SE
- 3467 Eisenhower Cir SE
- 3478 Garfield Way SE
- 3441 Eisenhower Cir SE Unit 4
- 3440 Eisenhower Cir SE Unit 4
- 3475 Eisenhower Cir SE
- 3486 Garfield Way SE
- 3470 Eisenhower Cir SE
- 3435 Eisenhower Cir SE
- 3422 Eisenhower Cir SE
- 3481 Eisenhower Cir SE
- 3480 Eisenhower Cir SE Unit 4
- 3490 Garfield Way SE
- 3489 Garfield Way SE Unit 10
- 3489 Garfield Way SE
- 3412 Eisenhower Cir SE
- 3487 Eisenhower Cir SE
- 1019 Eisenhower Ct SE