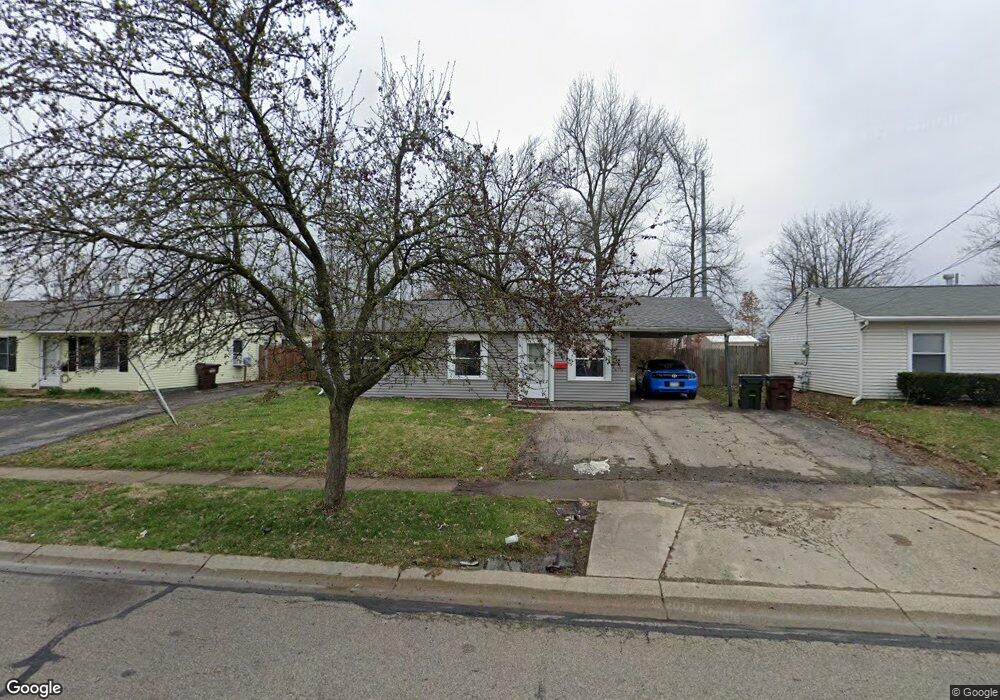
3453 Niagara St Cincinnati, OH 45251
Estimated Value: $134,000 - $207,000
4
Beds
2
Baths
1,369
Sq Ft
$124/Sq Ft
Est. Value
About This Home
This home is located at 3453 Niagara St, Cincinnati, OH 45251 and is currently estimated at $169,513, approximately $123 per square foot. 3453 Niagara St is a home located in Hamilton County with nearby schools including Taylor Elementary School, Pleasant Run Elementary School, and Pleasant Run Middle School.
Ownership History
Date
Name
Owned For
Owner Type
Purchase Details
Closed on
Oct 12, 2011
Sold by
Hoffbauer Christopher B
Bought by
Sanchez Gerardo
Current Estimated Value
Purchase Details
Closed on
Jul 22, 2005
Sold by
Clay Roy and Clay Bonnie
Bought by
Hoffbauer Christopher B
Home Financials for this Owner
Home Financials are based on the most recent Mortgage that was taken out on this home.
Original Mortgage
$82,603
Interest Rate
5.66%
Mortgage Type
FHA
Purchase Details
Closed on
Feb 24, 2000
Sold by
Wayne Collier and Wayne Elizabeth
Bought by
Clay Roy and Clay Bonnie
Home Financials for this Owner
Home Financials are based on the most recent Mortgage that was taken out on this home.
Original Mortgage
$57,600
Interest Rate
11.35%
Purchase Details
Closed on
Apr 3, 1998
Sold by
Parnell Ernest L and Parnell Mary L
Bought by
Collier Wayne and Collier Elizabeth
Home Financials for this Owner
Home Financials are based on the most recent Mortgage that was taken out on this home.
Original Mortgage
$49,600
Interest Rate
7.18%
Create a Home Valuation Report for This Property
The Home Valuation Report is an in-depth analysis detailing your home's value as well as a comparison with similar homes in the area
Home Values in the Area
Average Home Value in this Area
Purchase History
| Date | Buyer | Sale Price | Title Company |
|---|---|---|---|
| Sanchez Gerardo | $20,000 | Attorney | |
| Hoffbauer Christopher B | $83,900 | Buckeye Land Title Company | |
| Clay Roy | $52,000 | -- | |
| Collier Wayne | $35,000 | Land Title Agency Inc |
Source: Public Records
Mortgage History
| Date | Status | Borrower | Loan Amount |
|---|---|---|---|
| Previous Owner | Hoffbauer Christopher B | $82,603 | |
| Previous Owner | Clay Roy | $57,600 | |
| Previous Owner | Collier Wayne | $49,600 |
Source: Public Records
Tax History Compared to Growth
Tax History
| Year | Tax Paid | Tax Assessment Tax Assessment Total Assessment is a certain percentage of the fair market value that is determined by local assessors to be the total taxable value of land and additions on the property. | Land | Improvement |
|---|---|---|---|---|
| 2024 | $2,253 | $41,755 | $10,584 | $31,171 |
| 2023 | $2,267 | $41,755 | $10,584 | $31,171 |
| 2022 | $1,782 | $26,674 | $9,331 | $17,343 |
| 2021 | $1,767 | $26,674 | $9,331 | $17,343 |
| 2020 | $1,785 | $26,674 | $9,331 | $17,343 |
| 2019 | $1,552 | $21,511 | $7,525 | $13,986 |
| 2018 | $1,375 | $21,511 | $7,525 | $13,986 |
| 2017 | $1,303 | $21,511 | $7,525 | $13,986 |
| 2016 | $1,462 | $23,871 | $7,599 | $16,272 |
| 2015 | $1,477 | $23,871 | $7,599 | $16,272 |
| 2014 | $1,479 | $23,871 | $7,599 | $16,272 |
| 2013 | $1,482 | $25,127 | $7,998 | $17,129 |
Source: Public Records
Map
Nearby Homes
- 3351 Deshler Dr
- 3545 Alamosa Dr
- 9568 Woodstate Dr
- 9558 Woodstate Dr Unit 13E
- 3276 Deshler Dr
- 3275 Deshler Dr
- 3246 Ainsworth Dr
- 10005 Fairglen Dr
- 9446 Haddington Ct
- 9717 Loralinda Dr
- 9784 Loralinda Dr
- 3151 Birchway Dr Unit 3151
- 3463 Amberway Ct
- 9828 Loralinda Dr
- 3119 Deshler Dr
- 3719 Sagebrush Ln
- 3244 Springdale Rd
- 3258 Lillwood Ln
- 3013 Niagara St
- 9974 Marino Dr
- 3449 Niagara St
- 3459 Niagara St
- 3443 Niagara St
- 3463 Niagara St
- 3439 Niagara St
- 3449 Coleen Dr
- 3450 Niagara St
- 3444 Niagara St
- 3433 Niagara St
- 3443 Coleen Dr
- 3436 Niagara St
- 3557 Springdale Rd Unit B
- 3557 Springdale Rd
- 3470 Niagara St
- 3429 Niagara St
- 3428 Niagara St
- 3439 Coleen Dr
- 3476 Niagara St
- 3396 Deshler Dr
- 3483 Niagara St