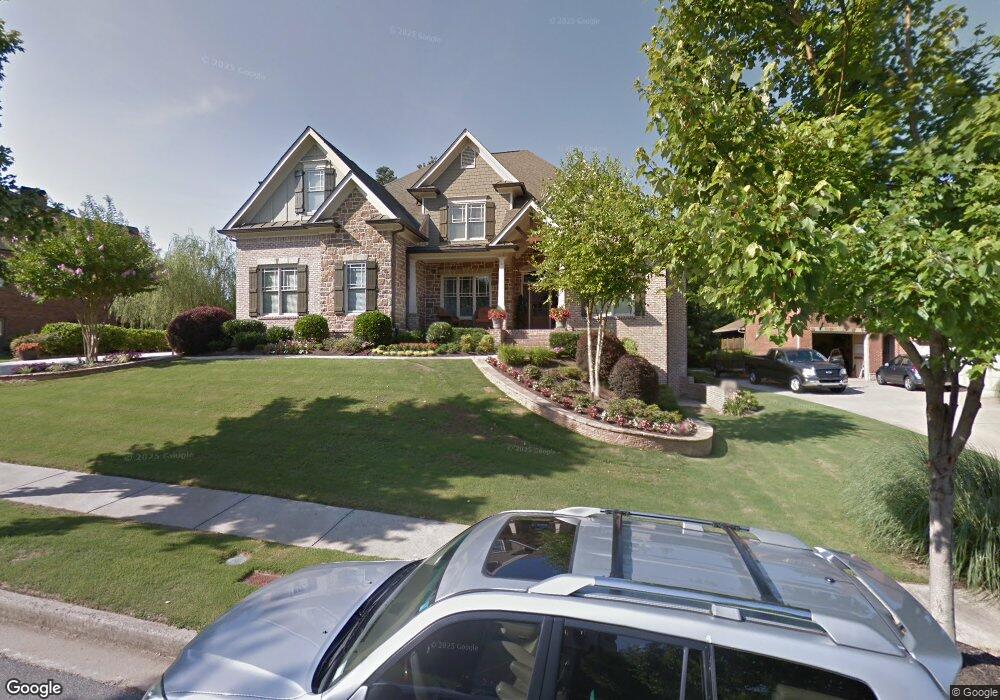
3454 Hidden Shoals Rd Buford, GA 30519
Estimated Value: $730,000 - $930,000
4
Beds
4
Baths
5,278
Sq Ft
$156/Sq Ft
Est. Value
About This Home
This home is located at 3454 Hidden Shoals Rd, Buford, GA 30519 and is currently estimated at $824,611, approximately $156 per square foot. 3454 Hidden Shoals Rd is a home located in Gwinnett County with nearby schools including Patrick Elementary School and Glenn C. Jones Middle School.
Ownership History
Date
Name
Owned For
Owner Type
Purchase Details
Closed on
Nov 1, 2010
Sold by
Almand Richard H
Bought by
Almand Richard H and Almand Paula O
Current Estimated Value
Home Financials for this Owner
Home Financials are based on the most recent Mortgage that was taken out on this home.
Original Mortgage
$150,000
Interest Rate
4.37%
Mortgage Type
New Conventional
Purchase Details
Closed on
Mar 6, 2006
Sold by
Northwood Prop Inc
Bought by
Foster Kirk W and Foster Jodi L
Home Financials for this Owner
Home Financials are based on the most recent Mortgage that was taken out on this home.
Original Mortgage
$428,000
Interest Rate
6.75%
Purchase Details
Closed on
Aug 10, 2004
Sold by
Jim Cowart Residential Llc
Bought by
Northwood Prop Inc
Home Financials for this Owner
Home Financials are based on the most recent Mortgage that was taken out on this home.
Original Mortgage
$166,500
Interest Rate
6.01%
Create a Home Valuation Report for This Property
The Home Valuation Report is an in-depth analysis detailing your home's value as well as a comparison with similar homes in the area
Home Values in the Area
Average Home Value in this Area
Purchase History
| Date | Buyer | Sale Price | Title Company |
|---|---|---|---|
| Almand Richard H | $398,500 | -- | |
| Almand Richard H | $398,500 | -- | |
| Foster Kirk W | $535,000 | -- | |
| Northwood Prop Inc | $185,000 | -- |
Source: Public Records
Mortgage History
| Date | Status | Borrower | Loan Amount |
|---|---|---|---|
| Closed | Almand Richard H | $150,000 | |
| Closed | Almand Richard H | $277,500 | |
| Previous Owner | Foster Kirk W | $428,000 | |
| Previous Owner | Northwood Prop Inc | $166,500 |
Source: Public Records
Tax History Compared to Growth
Tax History
| Year | Tax Paid | Tax Assessment Tax Assessment Total Assessment is a certain percentage of the fair market value that is determined by local assessors to be the total taxable value of land and additions on the property. | Land | Improvement |
|---|---|---|---|---|
| 2024 | $9,072 | $336,360 | $62,000 | $274,360 |
| 2023 | $9,072 | $318,600 | $62,000 | $256,600 |
| 2022 | $7,837 | $277,480 | $54,400 | $223,080 |
| 2021 | $6,740 | $218,200 | $46,400 | $171,800 |
| 2020 | $6,398 | $199,960 | $38,000 | $161,960 |
| 2019 | $5,993 | $189,200 | $38,000 | $151,200 |
| 2018 | $6,010 | $189,200 | $38,000 | $151,200 |
| 2016 | $5,659 | $172,000 | $38,000 | $134,000 |
| 2015 | $5,712 | $172,000 | $38,000 | $134,000 |
| 2014 | -- | $172,000 | $38,000 | $134,000 |
Source: Public Records
Map
Nearby Homes
- 3302 Anna Ruby Ln
- 2581 Trailing Ivy Way
- 2551 Kilgore Rd
- 2550 Kilgore Rd
- 2452 Kilgore Rd
- 2687 Black Fox Ct
- 3123 Walkers Falls Way
- 3379 Camp Branch Rd
- 2395 Kilgore Rd
- 3568 Foxworth Ct
- 2718 Kilgore Rd
- 2710 Kilgore Rd
- 2789 Kilgore Rd
- 2372 Wood Beil Ct
- 2372 Walkers Glen Ln
- 2330 Chandler Grove Dr
- 2381 Walkers Glen Ln Unit 2C
- 3045 Camp Branch Rd
- The Aspen A Plan at Fern Hollow
- The Hickory F Plan at Fern Hollow
- 3464 Hidden Shoals Rd
- 3444 Hidden Shoals Rd
- 2708 Dukes Creek Landing NE
- 2688 Dukes Creek Landing
- 0 Hidden Shoals Rd NE Unit 8814869
- 0 Hidden Shoals Rd NE Unit 8910955
- 0 Hidden Shoals Rd NE Unit 306
- 3455 Hidden Shoals Rd Unit 306
- 3455 Hidden Shoals Rd
- 0 Dukes Creek Landing NE
- 3474 Hidden Shoals Rd Unit 3474
- 3474 Hidden Shoals Rd
- 3474 Hidden Shoals Rd Unit 3
- 3445 Hidden Shoals Rd Unit 305
- 3445 Hidden Shoals Rd
- 0 Secret Shoals Way Unit 8572928
- 0 Secret Shoals Way Unit 8445958
- 0 Secret Shoals Way Unit 8311899
- 0 Secret Shoals Way Unit 8977269
- 0 Secret Shoals Way Unit 8966246