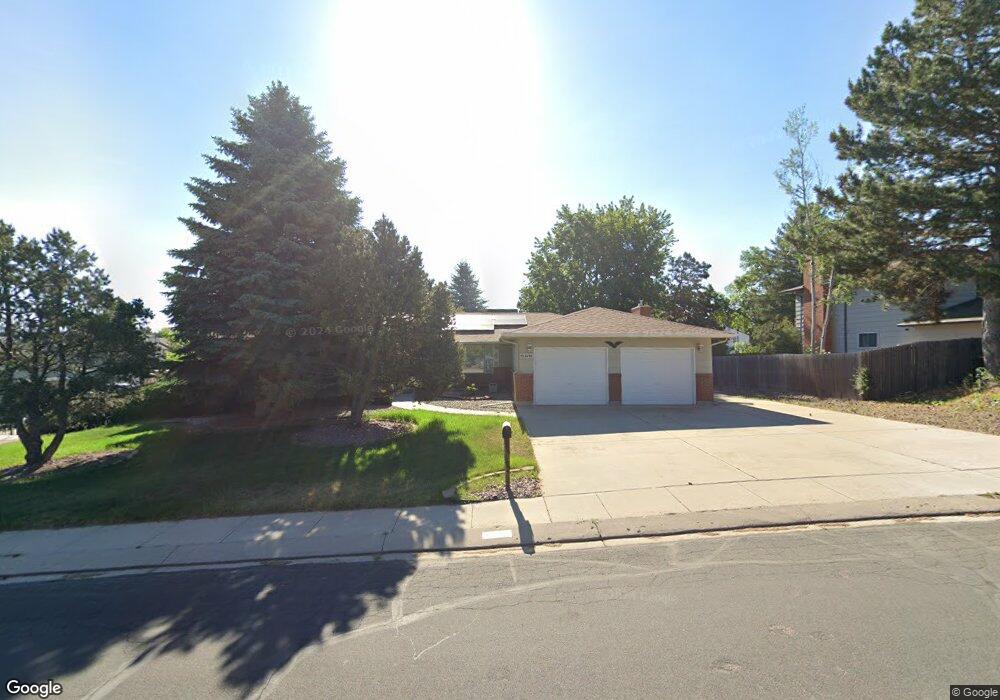
3455 Queen Anne Way Colorado Springs, CO 80917
Palmer Park NeighborhoodEstimated Value: $272,319 - $288,000
2
Beds
2
Baths
1,131
Sq Ft
$246/Sq Ft
Est. Value
About This Home
This home is located at 3455 Queen Anne Way, Colorado Springs, CO 80917 and is currently estimated at $278,330, approximately $246 per square foot. 3455 Queen Anne Way is a home located in El Paso County with nearby schools including Grant Elementary School, Mann Middle School, and Mitchell High School.
Ownership History
Date
Name
Owned For
Owner Type
Purchase Details
Closed on
Nov 30, 2009
Sold by
Scholl Ken
Bought by
Pashby Susan
Current Estimated Value
Home Financials for this Owner
Home Financials are based on the most recent Mortgage that was taken out on this home.
Original Mortgage
$117,826
Outstanding Balance
$77,207
Interest Rate
4.99%
Mortgage Type
FHA
Estimated Equity
$201,123
Purchase Details
Closed on
Aug 21, 2009
Sold by
Jones Gina and Jones Shane
Bought by
Scholl Ken
Purchase Details
Closed on
Aug 26, 2005
Sold by
Shaffer Kimberly Sue and Shaffer John Wendell
Bought by
Jones Shane and Jones Gina
Home Financials for this Owner
Home Financials are based on the most recent Mortgage that was taken out on this home.
Original Mortgage
$100,000
Interest Rate
6.5%
Mortgage Type
Fannie Mae Freddie Mac
Purchase Details
Closed on
May 1, 1995
Sold by
Shaffer Kimberly Sue and Wiedemann Kimberly Sue
Bought by
Shaffer Kimberly Sue and Shaffer John Wendell
Purchase Details
Closed on
Jul 1, 1985
Bought by
Pashby Susan
Create a Home Valuation Report for This Property
The Home Valuation Report is an in-depth analysis detailing your home's value as well as a comparison with similar homes in the area
Home Values in the Area
Average Home Value in this Area
Purchase History
| Date | Buyer | Sale Price | Title Company |
|---|---|---|---|
| Pashby Susan | $120,000 | North American Title Company | |
| Scholl Ken | -- | None Available | |
| Jones Shane | $125,000 | -- | |
| Shaffer Kimberly Sue | -- | -- | |
| Pashby Susan | -- | -- |
Source: Public Records
Mortgage History
| Date | Status | Borrower | Loan Amount |
|---|---|---|---|
| Open | Pashby Susan | $117,826 | |
| Previous Owner | Jones Shane | $100,000 |
Source: Public Records
Tax History Compared to Growth
Tax History
| Year | Tax Paid | Tax Assessment Tax Assessment Total Assessment is a certain percentage of the fair market value that is determined by local assessors to be the total taxable value of land and additions on the property. | Land | Improvement |
|---|---|---|---|---|
| 2025 | $802 | $20,730 | -- | -- |
| 2024 | $695 | $18,820 | $3,870 | $14,950 |
| 2022 | $823 | $14,710 | $2,780 | $11,930 |
| 2021 | $893 | $15,130 | $2,860 | $12,270 |
| 2020 | $810 | $11,940 | $1,720 | $10,220 |
| 2019 | $806 | $11,940 | $1,720 | $10,220 |
| 2018 | $670 | $9,130 | $1,330 | $7,800 |
| 2017 | $634 | $9,130 | $1,330 | $7,800 |
| 2016 | $554 | $9,560 | $1,350 | $8,210 |
| 2015 | $552 | $9,560 | $1,350 | $8,210 |
| 2014 | $547 | $9,090 | $1,270 | $7,820 |
Source: Public Records
Map
Nearby Homes
- 3457 Queen Anne Way
- 3515 Queen Anne Way
- 3509 Queen Anne Way
- 3516 Queen Anne Way
- 3660 E Wade Ln
- 3548 Queen Anne Way
- 3619 Queen Anne Way
- 3618 Queen Anne Way
- 3342 Queen Anne Way
- 3643 Queen Anne Way
- 3676 Queen Anne Way
- 3415 Rebecca Ln Unit F
- 3435 Rebecca Ln Unit A
- 3250 van Teylingen Dr Unit D
- 3230 van Teylingen Dr Unit C
- 3220 van Teylingen Dr Unit L
- 3210 van Teylingen Dr Unit B
- 3210 van Teylingen Dr
- 3530 Parkmoor Village Dr Unit F
- 3655 Parkmoor Village Dr
- 3453 Queen Anne Way
- 3451 Queen Anne Way
- 3449 Queen Anne Way
- 3447 Queen Anne Way
- 3445 Queen Anne Way
- 3443 Queen Anne Way
- 3441 Queen Anne Way
- 3465 Queen Anne Way
- 3463 Queen Anne Way
- 3467 Queen Anne Way
- 3461 Queen Anne Way
- 3439 Queen Anne Way
- 3469 Queen Anne Way
- 3437 Queen Anne Way
- 3471 Queen Anne Way
- 3473 Queen Anne Way
- 3435 Queen Anne Way
- 3475 Queen Anne Way
- 3425 Queen Anne Way
- 3645 E Wade Ln