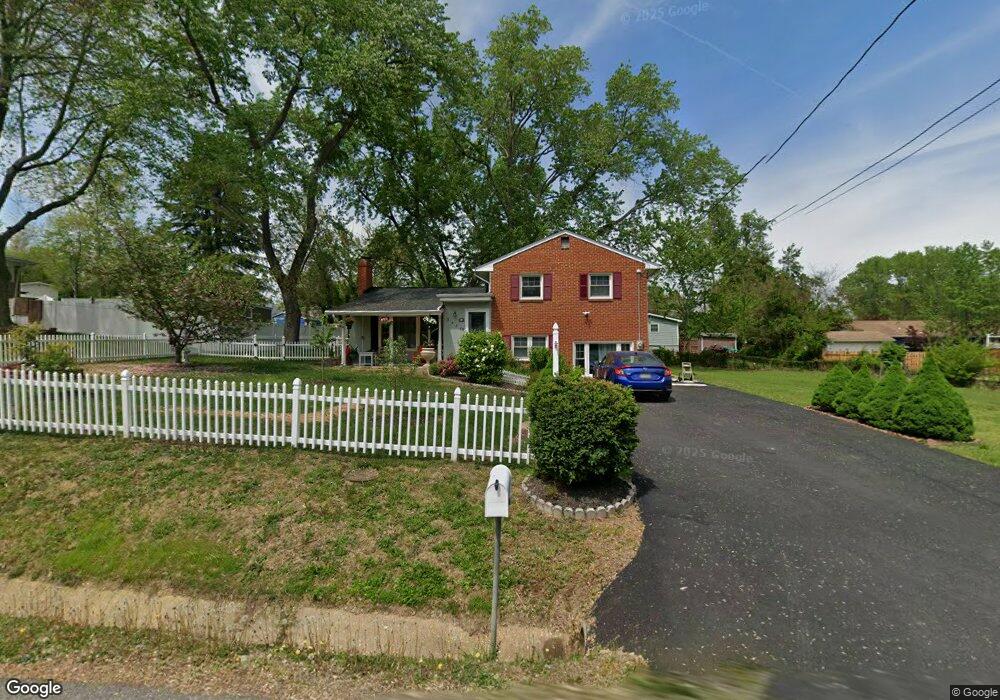
3458 Little Hunting Creek Dr Alexandria, VA 22309
Estimated Value: $589,000 - $618,857
4
Beds
2
Baths
1,086
Sq Ft
$549/Sq Ft
Est. Value
About This Home
This home is located at 3458 Little Hunting Creek Dr, Alexandria, VA 22309 and is currently estimated at $596,714, approximately $549 per square foot. 3458 Little Hunting Creek Dr is a home located in Fairfax County with nearby schools including Riverside Elementary School, Whitman Middle School, and Mount Vernon High.
Ownership History
Date
Name
Owned For
Owner Type
Purchase Details
Closed on
Jul 6, 2021
Sold by
Castellon Michael Edward
Bought by
Castellon Jose A and Castellon Dina E
Current Estimated Value
Home Financials for this Owner
Home Financials are based on the most recent Mortgage that was taken out on this home.
Original Mortgage
$243,000
Outstanding Balance
$150,394
Interest Rate
2.96%
Mortgage Type
New Conventional
Estimated Equity
$446,320
Purchase Details
Closed on
Mar 8, 2021
Sold by
Castellon Jose A and Castellon Dina E
Bought by
Castellon Michael Edward
Purchase Details
Closed on
Sep 24, 1996
Sold by
Morris Leland
Bought by
Castellon Jose A
Home Financials for this Owner
Home Financials are based on the most recent Mortgage that was taken out on this home.
Original Mortgage
$156,289
Interest Rate
7.89%
Create a Home Valuation Report for This Property
The Home Valuation Report is an in-depth analysis detailing your home's value as well as a comparison with similar homes in the area
Home Values in the Area
Average Home Value in this Area
Purchase History
| Date | Buyer | Sale Price | Title Company |
|---|---|---|---|
| Castellon Jose A | -- | None Listed On Document | |
| Castellon Jose A | -- | Accommodation | |
| Castellon Michael Edward | $1,000 | None Listed On Document | |
| Castellon Michael Edward | $1,000 | None Listed On Document | |
| Castellon Michael Edward | $1,000 | None Available | |
| Castellon Jose A | $160,000 | -- |
Source: Public Records
Mortgage History
| Date | Status | Borrower | Loan Amount |
|---|---|---|---|
| Open | Castellon Jose A | $243,000 | |
| Closed | Castellon Jose A | $243,000 | |
| Previous Owner | Castellon Jose A | $156,289 |
Source: Public Records
Tax History Compared to Growth
Tax History
| Year | Tax Paid | Tax Assessment Tax Assessment Total Assessment is a certain percentage of the fair market value that is determined by local assessors to be the total taxable value of land and additions on the property. | Land | Improvement |
|---|---|---|---|---|
| 2025 | $6,596 | $513,310 | $300,000 | $213,310 |
| 2024 | $6,596 | $521,460 | $306,000 | $215,460 |
| 2023 | $6,304 | $515,180 | $306,000 | $209,180 |
| 2022 | $6,110 | $492,770 | $306,000 | $186,770 |
| 2021 | $5,357 | $422,410 | $289,000 | $133,410 |
| 2020 | $5,385 | $423,760 | $289,000 | $134,760 |
| 2019 | $5,071 | $395,940 | $270,000 | $125,940 |
| 2018 | $4,216 | $366,610 | $250,000 | $116,610 |
| 2017 | $4,629 | $368,990 | $250,000 | $118,990 |
| 2016 | $4,527 | $360,960 | $243,000 | $117,960 |
| 2015 | $4,075 | $334,220 | $225,000 | $109,220 |
| 2014 | $3,765 | $307,130 | $206,000 | $101,130 |
Source: Public Records
Map
Nearby Homes
- 3426 Ramsgate Terrace
- 3416 Sunny View Dr
- 8413 Wagon Wheel Rd
- 3017 Battersea Ln
- 8298 Jake Place
- 8352 Orange Ct
- 3026 Battersea Ln
- 8101 Richmond Hwy
- 2757 Carter Farm Ct
- 3775 Shannons Green Way
- 3221 Napper Rd
- 8212 La Faye Ct
- 8259 Cedar Landing Ct
- 3108 Battersea Ln
- 8531 Mount Vernon Hwy
- 8225 Cedar Landing Ct
- 2907 Dumas St
- 2817 Derek Rd
- 8219 Doctor Craik Ct
- 3301 Battersea Ln
- 3303 Ayers Dr
- 3456 Little Hunting Creek Dr
- 3460 Little Hunting Creek Dr
- 3301 Ayers Dr
- 3305 Ayers Dr
- 3457 Little Hunting Creek Dr
- 3459 Little Hunting Creek Dr
- 3455 Little Hunting Creek Dr
- 3462 Little Hunting Creek Dr
- 3401 Ayers Dr
- 3453 Little Hunting Creek Dr
- 3461 Little Hunting Creek Dr
- 3450 Little Hunting Creek Dr
- 3400 Little Hunting Creek Dr
- 3302 Ayers Dr
- 3207 Ayers Dr
- 8271 Media St
- 3464 Little Hunting Creek Dr
- 3451 Little Hunting Creek Dr
- 8305 Sabine St