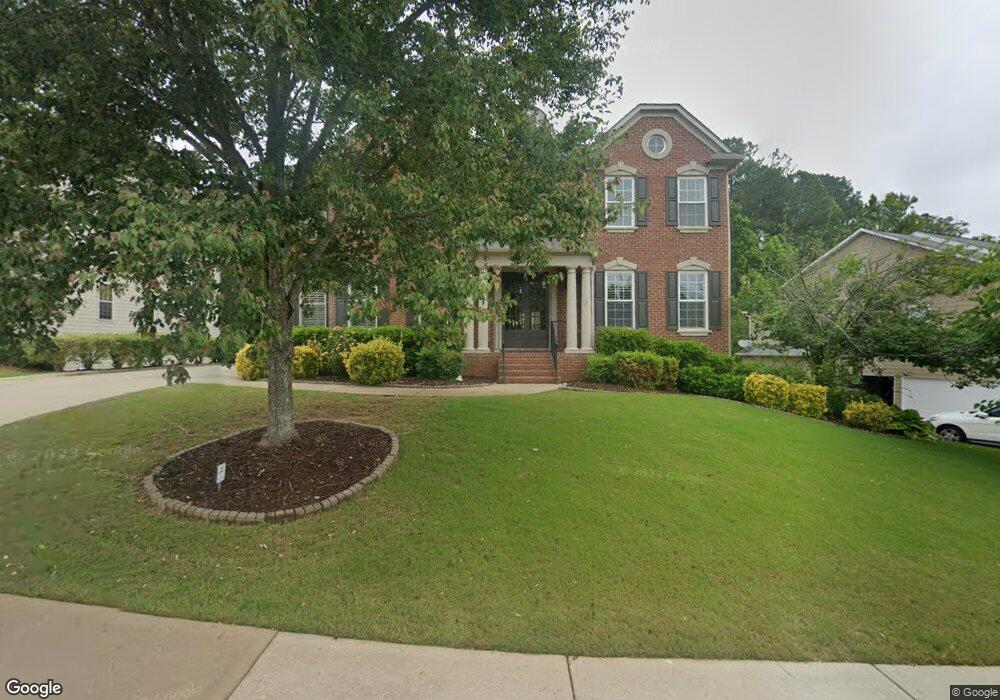
346 Bennington Place Unit 697 Canton, GA 30115
Union Hill NeighborhoodEstimated Value: $674,000 - $721,294
4
Beds
4
Baths
3,692
Sq Ft
$189/Sq Ft
Est. Value
About This Home
This home is located at 346 Bennington Place Unit 697, Canton, GA 30115 and is currently estimated at $697,647, approximately $188 per square foot. 346 Bennington Place Unit 697 is a home located in Cherokee County with nearby schools including Macedonia Elementary School, Creekland Middle School, and Creekview High School.
Ownership History
Date
Name
Owned For
Owner Type
Purchase Details
Closed on
Aug 30, 2017
Sold by
Jones Benjamin
Bought by
Glassford Sean F and Glassford Alicia Brown
Current Estimated Value
Home Financials for this Owner
Home Financials are based on the most recent Mortgage that was taken out on this home.
Original Mortgage
$365,079
Outstanding Balance
$305,218
Interest Rate
4.12%
Mortgage Type
FHA
Estimated Equity
$392,429
Purchase Details
Closed on
Jun 30, 2015
Sold by
Trussell Ronald T
Bought by
Jones Benjamin L and Jones Bethany M
Home Financials for this Owner
Home Financials are based on the most recent Mortgage that was taken out on this home.
Original Mortgage
$287,200
Interest Rate
3.92%
Purchase Details
Closed on
Apr 30, 2009
Sold by
Hms John Wieland and Hms Neighborhoo
Bought by
Trussell Ronald T
Home Financials for this Owner
Home Financials are based on the most recent Mortgage that was taken out on this home.
Original Mortgage
$259,920
Interest Rate
4.79%
Mortgage Type
New Conventional
Create a Home Valuation Report for This Property
The Home Valuation Report is an in-depth analysis detailing your home's value as well as a comparison with similar homes in the area
Home Values in the Area
Average Home Value in this Area
Purchase History
| Date | Buyer | Sale Price | Title Company |
|---|---|---|---|
| Glassford Sean F | $380,000 | -- | |
| Jones Benjamin L | $359,000 | -- | |
| Trussell Ronald T | $325,000 | -- |
Source: Public Records
Mortgage History
| Date | Status | Borrower | Loan Amount |
|---|---|---|---|
| Open | Glassford Sean F | $365,079 | |
| Previous Owner | Jones Benjamin L | $287,200 | |
| Previous Owner | Trussell Ronald T | $259,920 |
Source: Public Records
Tax History Compared to Growth
Tax History
| Year | Tax Paid | Tax Assessment Tax Assessment Total Assessment is a certain percentage of the fair market value that is determined by local assessors to be the total taxable value of land and additions on the property. | Land | Improvement |
|---|---|---|---|---|
| 2025 | $6,523 | $277,000 | $49,200 | $227,800 |
| 2024 | $6,101 | $256,520 | $46,800 | $209,720 |
| 2023 | $5,720 | $259,080 | $46,800 | $212,280 |
| 2022 | $5,303 | $215,680 | $39,200 | $176,480 |
| 2021 | $4,575 | $165,440 | $24,000 | $141,440 |
| 2020 | $4,451 | $159,960 | $24,000 | $135,960 |
| 2019 | $4,377 | $154,040 | $24,000 | $130,040 |
| 2018 | $4,167 | $145,760 | $24,000 | $121,760 |
| 2017 | $3,777 | $353,600 | $24,000 | $117,440 |
| 2016 | $3,777 | $330,100 | $24,000 | $108,040 |
| 2015 | $3,684 | $319,000 | $24,000 | $103,600 |
| 2014 | -- | $292,000 | $20,000 | $96,800 |
Source: Public Records
Map
Nearby Homes
- 339 Bennington Place
- 10307 E Cherokee Dr
- 10381 E Cherokee Dr
- 403 Glenhurst Trace Unit 9B
- 147 Cadence Trail
- 2034 W Hampton Dr
- 10561 E Cherokee Dr
- 4008 Creekshire Trail
- 11267 E Cherokee Dr
- 329 Owens Store Rd
- 205 Carrington Point
- 164 Aspen Hall Dr
- 00 Cumming Hwy
- 4527 Cumming Hwy
- 176 Aspen Hall Dr
- 514 Macedonia Forest Cir
- 00 Memory Ln
- 135 Aspen Hall Dr
- 346 Bennington Place
- 344 Bennington Place
- 348 Bennington Place Unit 348
- 348 Bennington Place
- 348 Bennington Place Unit 16
- 342 Bennington Place
- 0 Bennington Place Unit 8420556
- 0 Bennington Place Unit 3264965
- 0 Bennington Place Unit 7352655
- 0 Bennington Place Unit 7111623
- 0 Bennington Place Unit 3131139
- 0 Bennington Place Unit 3221058
- 0 Bennington Place Unit 7355396
- 0 Bennington Place Unit 7442056
- 0 Bennington Place Unit 8104044
- 350 Bennington Place
- 331 Bennington Place
- 335 Bennington Place
- 333 Bennington Place
- 340 Bennington Place