Estimated Value: $445,000 - $546,000
5
Beds
3
Baths
2,772
Sq Ft
$175/Sq Ft
Est. Value
About This Home
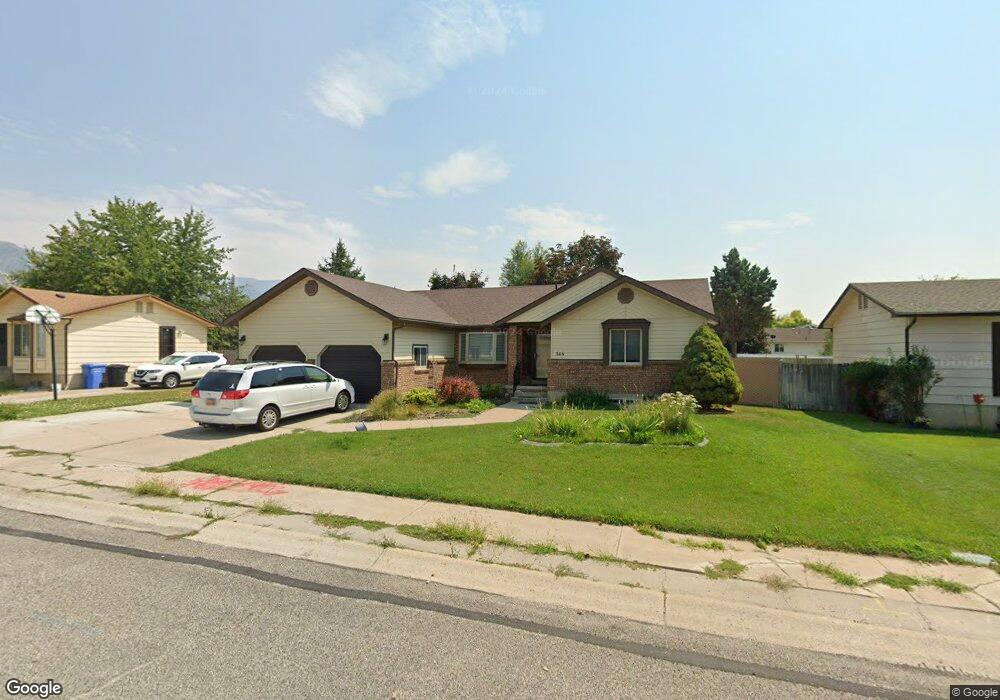
This home is located at 346 E 2520 N, Logan, UT 84341 and is currently estimated at $486,053, approximately $175 per square foot. 346 E 2520 N is a home located in Cache County with nearby schools including Greenville School, Cedar Ridge School, and North Cache Middle School.
Ownership History
Date
Name
Owned For
Owner Type
Purchase Details
Closed on
Jun 24, 2020
Sold by
Bowman James S and Bowman Juanita B
Bought by
Oliphant Alex W and Oliphant Monica M
Current Estimated Value
Home Financials for this Owner
Home Financials are based on the most recent Mortgage that was taken out on this home.
Original Mortgage
$264,775
Outstanding Balance
$234,184
Interest Rate
3.2%
Mortgage Type
New Conventional
Estimated Equity
$251,869
Purchase Details
Closed on
May 13, 2020
Sold by
Bowman James S and Bowman Juanita B
Bought by
Bowman James S and Bowman Juanita B
Home Financials for this Owner
Home Financials are based on the most recent Mortgage that was taken out on this home.
Original Mortgage
$264,775
Outstanding Balance
$234,184
Interest Rate
3.2%
Mortgage Type
New Conventional
Estimated Equity
$251,869
Create a Home Valuation Report for This Property
The Home Valuation Report is an in-depth analysis detailing your home's value as well as a comparison with similar homes in the area
Home Values in the Area
Average Home Value in this Area
Purchase History
| Date | Buyer | Sale Price | Title Company |
|---|---|---|---|
| Oliphant Alex W | -- | Cache Title Logan | |
| Bowman James S | -- | None Available | |
| Bowman James S | -- | None Available |
Source: Public Records
Mortgage History
| Date | Status | Borrower | Loan Amount |
|---|---|---|---|
| Open | Oliphant Alex W | $264,775 | |
| Closed | Bowman James S | $186,000 |
Source: Public Records
Tax History
| Year | Tax Paid | Tax Assessment Tax Assessment Total Assessment is a certain percentage of the fair market value that is determined by local assessors to be the total taxable value of land and additions on the property. | Land | Improvement |
|---|---|---|---|---|
| 2025 | $1,810 | $253,395 | $0 | $0 |
| 2024 | $1,922 | $250,350 | $0 | $0 |
| 2023 | $2,059 | $247,975 | $0 | $0 |
| 2022 | $1,868 | $214,975 | $0 | $0 |
| 2021 | $1,751 | $312,200 | $50,000 | $262,200 |
| 2020 | $1,607 | $268,500 | $50,000 | $218,500 |
| 2019 | $1,376 | $219,561 | $50,000 | $169,561 |
| 2018 | $1,254 | $193,696 | $50,000 | $143,696 |
| 2017 | $1,125 | $91,465 | $0 | $0 |
| 2016 | $1,143 | $91,465 | $0 | $0 |
| 2015 | $1,148 | $91,465 | $0 | $0 |
| 2014 | $1,111 | $90,590 | $0 | $0 |
| 2013 | -- | $90,590 | $0 | $0 |
Source: Public Records
Map
Nearby Homes
- 623 E 2475 N Unit 5
- 645 E 2475 N
- 667 E 2475 N
- 2592 N 330 E
- 2460 N 200 E
- 2664 N 330 E
- 2452 N 200 E
- 2640 N Aspen Park Ln
- 161 E 2440 N
- 385 E 2280 N Unit D
- 2386 N 150 E
- 327 E 2230 N Unit A
- 2469 N 620 E Unit 3
- 2477 N 620 E Unit 4
- 2070 U S 91
- 2284 N 740 E
- 2048 N 350 E
- 2807 N Main St
- 741 E 2200 N
- 680 S 50 E Unit 112
Your Personal Tour Guide
Ask me questions while you tour the home.