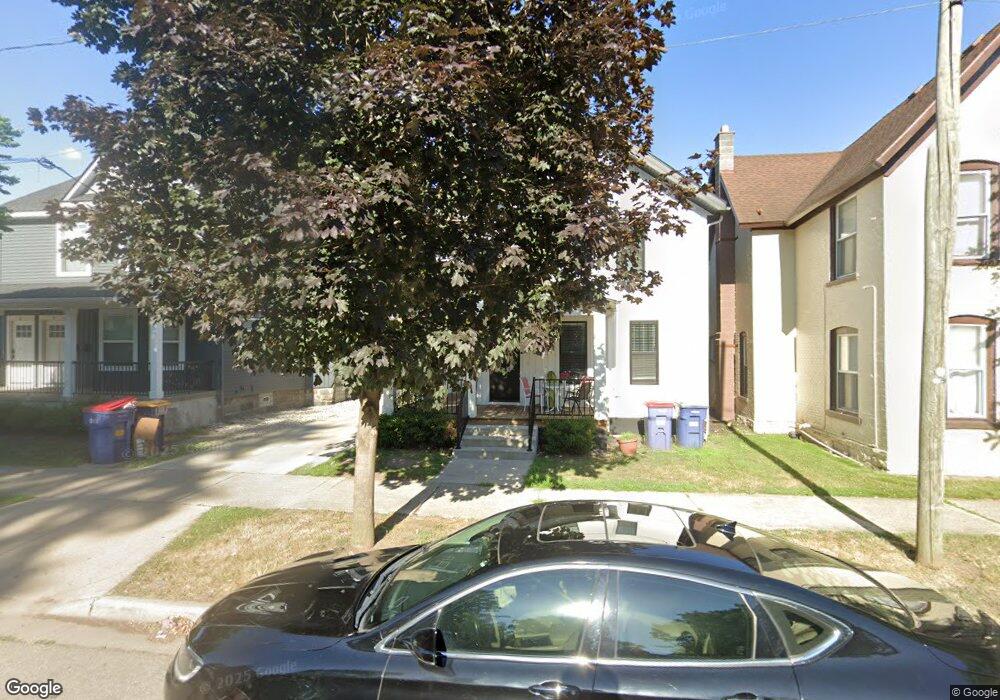
346 Marion Ave NW Unit 348 Grand Rapids, MI 49504
SWAN NeighborhoodEstimated Value: $245,000 - $307,671
--
Bed
--
Bath
2,253
Sq Ft
$128/Sq Ft
Est. Value
About This Home
This home is located at 346 Marion Ave NW Unit 348, Grand Rapids, MI 49504 and is currently estimated at $288,168, approximately $127 per square foot. 346 Marion Ave NW Unit 348 is a home located in Kent County with nearby schools including Sibley School, Westwood Middle School, and Union High School.
Ownership History
Date
Name
Owned For
Owner Type
Purchase Details
Closed on
Jun 16, 2020
Sold by
Herrick Russell
Bought by
Slick Investments Llc
Current Estimated Value
Purchase Details
Closed on
Jun 19, 2007
Sold by
Sochanek David and Sochanek Valerie
Bought by
Herrick Russell
Purchase Details
Closed on
Sep 14, 2004
Sold by
Sochanek David and Hayden Laura
Bought by
Herrick Russell
Purchase Details
Closed on
Dec 4, 1997
Sold by
Ts Brnk D and Ts M
Bought by
Danmar Properties Lc and Herrick Russell
Purchase Details
Closed on
Jun 20, 1991
Sold by
Stewart Stewart P P and Stewart Brink D
Bought by
Herrick Russell
Purchase Details
Closed on
Jun 27, 1990
Sold by
Trst Brink D and Trst Brink D
Bought by
Herrick Russell
Purchase Details
Closed on
Jun 26, 1990
Sold by
Stewart Stewart P P and Stewart Brink D
Bought by
Herrick Russell
Purchase Details
Closed on
May 6, 1988
Bought by
Herrick Russell
Create a Home Valuation Report for This Property
The Home Valuation Report is an in-depth analysis detailing your home's value as well as a comparison with similar homes in the area
Home Values in the Area
Average Home Value in this Area
Purchase History
| Date | Buyer | Sale Price | Title Company |
|---|---|---|---|
| Slick Investments Llc | $110,000 | None Available | |
| Herrick Russell | $84,900 | None Available | |
| Sochanek David | $79,500 | None Available | |
| Herrick Russell | -- | -- | |
| Danmar Properties Lc | -- | -- | |
| Herrick Russell | $49,300 | -- | |
| Herrick Russell | -- | -- | |
| Herrick Russell | -- | -- | |
| Herrick Russell | $33,100 | -- |
Source: Public Records
Tax History Compared to Growth
Tax History
| Year | Tax Paid | Tax Assessment Tax Assessment Total Assessment is a certain percentage of the fair market value that is determined by local assessors to be the total taxable value of land and additions on the property. | Land | Improvement |
|---|---|---|---|---|
| 2025 | $5,246 | $164,600 | $0 | $0 |
| 2024 | $5,246 | $146,500 | $0 | $0 |
| 2023 | $5,203 | $131,600 | $0 | $0 |
| 2022 | $4,945 | $108,800 | $0 | $0 |
| 2021 | $2,829 | $54,200 | $0 | $0 |
| 2020 | $1,816 | $71,700 | $0 | $0 |
| 2019 | $1,859 | $56,900 | $0 | $0 |
| 2018 | $1,802 | $46,000 | $0 | $0 |
| 2017 | $1,758 | $38,800 | $0 | $0 |
| 2016 | $1,767 | $36,500 | $0 | $0 |
| 2015 | $1,683 | $36,500 | $0 | $0 |
| 2013 | -- | $31,900 | $0 | $0 |
Source: Public Records
Map
Nearby Homes
- 1153 Bridge St NW
- 343 Garfield Ave NW
- 1005 Jackson St NW Unit 1007
- 539 Pine Ave NW
- 854 First St NW
- 561 Lane Ave NW
- 1001 Lake Michigan Dr NW
- 545 Garfield Ave NW
- 853 Second St NW
- 560 Garfield Ave NW
- 564 Garfield Ave NW
- 609 Lincoln Ave NW
- 1169 3rd St NW
- 1015 California St NW
- 800 Douglas St NW
- 940 Lake Michigan Dr NW
- 1209 California St NW
- 921 4th St NW
- 1016 California St NW
- 226 Sunset Ave NW
- 346 Marion Ave NW
- 342 Marion Ave NW
- 350 Marion Ave NW
- 1050 Bridge St NW
- 1048 Bridge St NW
- 338 Marion Ave NW
- 1044 Bridge St NW
- 343 Pine Ave NW
- 330 Marion Ave NW
- 330 Marion Ave NW Unit 332
- 347 Pine Ave NW
- 349 Pine Ave NW
- 337 Pine Ave NW
- 0 Bridge St NW Unit 801 M16059272
- 0 Bridge St NW Unit M18011943
- 0 Bridge St NW Unit 1402 M19032356
- 0 Bridge St NW Unit 805 M19031764
- 0 Bridge St NW Unit 2105 M19032322
- 0 Bridge St NW Unit 2105 M19048328
- 0 Bridge St NW Unit 2200 M19048480