Estimated Value: $472,000 - $635,000
--
Bed
1
Bath
3,386
Sq Ft
$169/Sq Ft
Est. Value
About This Home
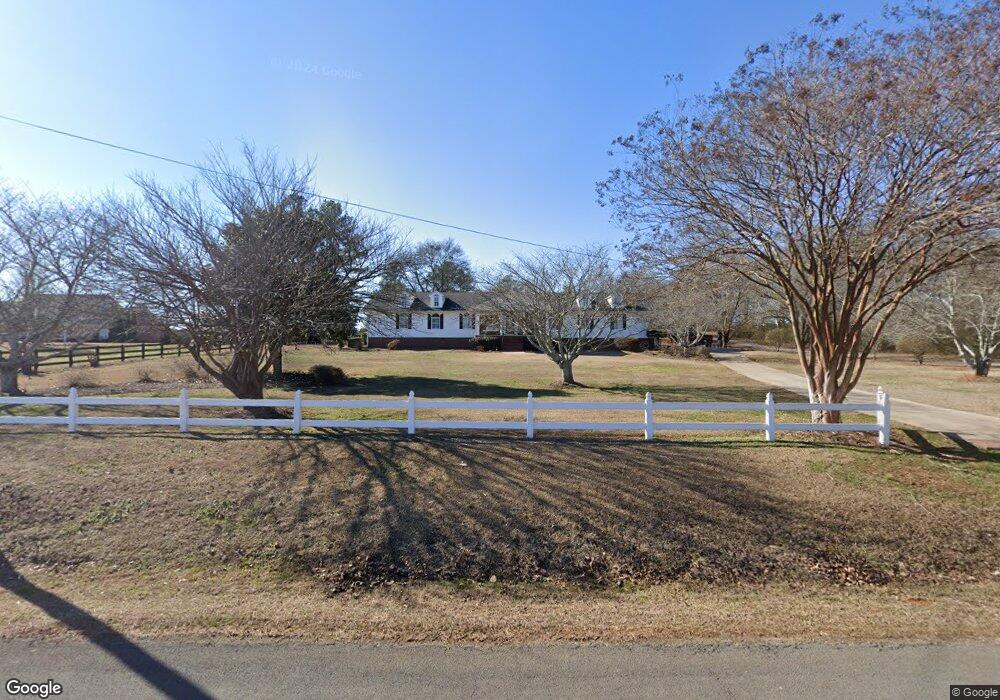
This home is located at 346 Reynolds Bend Rd SE, Rome, GA 30161 and is currently estimated at $571,791, approximately $168 per square foot. 346 Reynolds Bend Rd SE is a home located in Floyd County with nearby schools including Model Middle School and Model High School.
Ownership History
Date
Name
Owned For
Owner Type
Purchase Details
Closed on
Dec 18, 2020
Sold by
Cawa Angela K
Bought by
Groves John T
Current Estimated Value
Purchase Details
Closed on
Feb 19, 2001
Sold by
Sloan Michael A and Sloan Janet M
Bought by
Groves John T and Cawa Angela K
Purchase Details
Closed on
Aug 31, 2000
Bought by
P and R
Purchase Details
Closed on
Dec 22, 1997
Sold by
Toles Temple & Wright Inc
Bought by
Sloan Michael A and Sloan Janet M
Purchase Details
Closed on
Dec 5, 1997
Sold by
Jones Craig A
Bought by
Toles Temple & Wright Inc
Purchase Details
Closed on
Sep 25, 1997
Sold by
Cook Donna T
Bought by
Jones Craig A
Purchase Details
Closed on
Aug 18, 1997
Sold by
Cook James Ronald and Cook Donna T
Bought by
Cook Donna T
Purchase Details
Closed on
Jan 29, 1992
Bought by
Cook James Ronald and Cook Donna T
Create a Home Valuation Report for This Property
The Home Valuation Report is an in-depth analysis detailing your home's value as well as a comparison with similar homes in the area
Home Values in the Area
Average Home Value in this Area
Purchase History
| Date | Buyer | Sale Price | Title Company |
|---|---|---|---|
| Groves John T | -- | -- | |
| Groves John T | $319,500 | -- | |
| P | -- | -- | |
| Sloan Michael A | $58,000 | -- | |
| Toles Temple & Wright Inc | $52,000 | -- | |
| Jones Craig A | $32,200 | -- | |
| Cook Donna T | -- | -- | |
| Cook James Ronald | $20,500 | -- |
Source: Public Records
Tax History Compared to Growth
Tax History
| Year | Tax Paid | Tax Assessment Tax Assessment Total Assessment is a certain percentage of the fair market value that is determined by local assessors to be the total taxable value of land and additions on the property. | Land | Improvement |
|---|---|---|---|---|
| 2024 | $5,696 | $269,964 | $21,039 | $248,925 |
| 2023 | $5,737 | $226,861 | $19,126 | $207,735 |
| 2022 | $4,529 | $189,550 | $15,902 | $173,648 |
| 2021 | $3,872 | $149,558 | $14,412 | $135,146 |
| 2020 | $3,515 | $128,608 | $12,532 | $116,076 |
| 2019 | $3,376 | $123,170 | $12,532 | $110,638 |
| 2018 | $3,268 | $116,933 | $11,938 | $104,995 |
| 2017 | $3,173 | $111,439 | $11,053 | $100,386 |
| 2016 | $3,178 | $109,690 | $11,040 | $98,650 |
| 2015 | $3,113 | $109,690 | $11,040 | $98,650 |
| 2014 | $3,113 | $109,690 | $11,040 | $98,650 |
Source: Public Records
Map
Nearby Homes
- 127 Branson Rd SE
- 8 Trimble Way SE
- 158 Sproull Rd SE
- 0 Mountain Creek Dr SE Unit 10436191
- 139 Shoals Ferry Rd SE
- 13 Broken Arrow Trail SE
- 9 Everwood Ct SE
- 11 Everwood Ct SE
- 38 Parkwood Cir NE
- 16 Fallen Branch Cir SE
- 0 Fallen Branch Cir SE Unit 10311756
- 0 Fallen Branch Cir SE Unit 10172755
- 0 Fallen Branch Cir SE Unit 7234792
- 1 Outpost Trail SE
- 21 Everwood Ct SE
- 25 Everwood Ct SE
- 291 Youngs Mill Rd
- 818 Morrison Camp Ground Rd NE
- 567 Fred Kelley Rd NE
- 96 Collins Rd NE
- 380 Reynolds Bend Rd SE
- 374 Reynolds Bend Rd SE
- 360 Reynolds Bend Rd SE
- 312 Reynolds Bend Rd SE
- 312 Reynolds Bend Rd SE
- 340 Branson Rd SE
- 400 Reynolds Bend Rd SE
- 284 Reynolds Bend Rd SE
- 248 Reynolds Bend Rd SE
- 248 Reynolds Bend Rd SE
- 446 Reynolds Bend Rd SE
- 306 Branson Rd SE
- 210 Branson Rd SE
- 326 Branson Rd SE
- 480 Reynolds Bend Rd SE
- 644 Reynolds Bend Rd SE
- 186 Reynolds Bend Rd SE
- 339 Reynolds Bend Rd SE
- 339 Reynolds Bend Rd SE Unit 30
- 190 Branson Rd SE