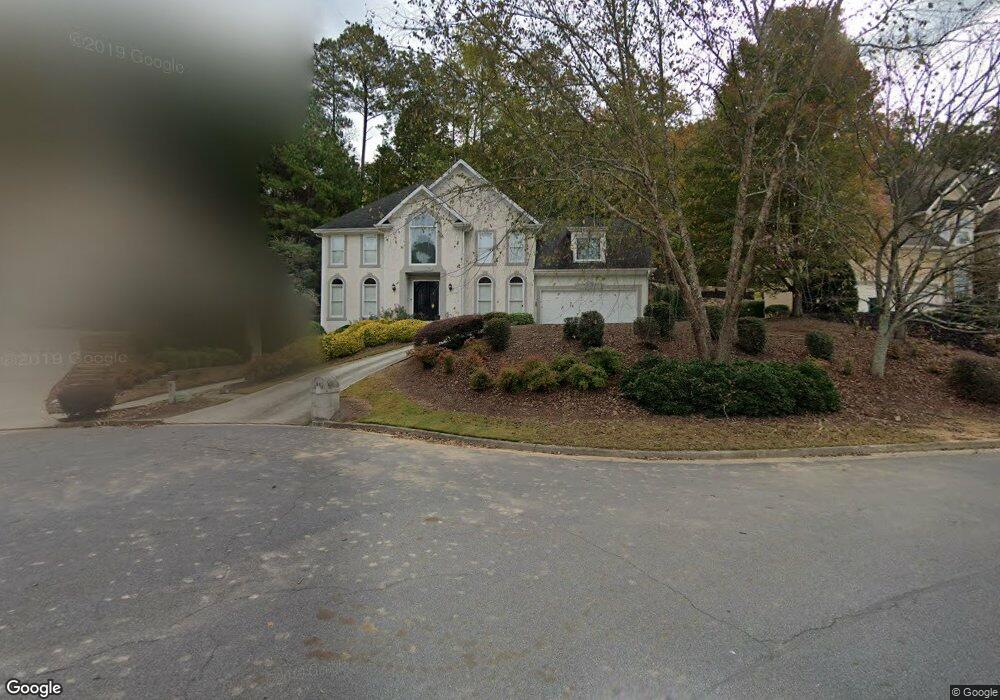
3460 Merganser Ln Alpharetta, GA 30022
Newtown NeighborhoodEstimated Value: $696,000 - $858,000
5
Beds
6
Baths
2,980
Sq Ft
$266/Sq Ft
Est. Value
About This Home
This home is located at 3460 Merganser Ln, Alpharetta, GA 30022 and is currently estimated at $791,423, approximately $265 per square foot. 3460 Merganser Ln is a home located in Fulton County with nearby schools including Barnwell Elementary School, Haynes Bridge Middle School, and Centennial High School.
Ownership History
Date
Name
Owned For
Owner Type
Purchase Details
Closed on
Nov 23, 2010
Sold by
Jackason Brian K
Bought by
Jackson Brian K and Jackson Felicia L
Current Estimated Value
Home Financials for this Owner
Home Financials are based on the most recent Mortgage that was taken out on this home.
Original Mortgage
$354,215
Outstanding Balance
$234,063
Interest Rate
4.3%
Mortgage Type
VA
Estimated Equity
$557,360
Purchase Details
Closed on
Aug 13, 2009
Sold by
Mcandrew Thomas H
Bought by
Mcandrew Cynthia L
Purchase Details
Closed on
May 29, 2002
Sold by
Mcandrew Thomas H
Bought by
Mcandrew Cynthia L
Purchase Details
Closed on
Jul 15, 1996
Sold by
Cornerstone Craftmen Inc
Bought by
Mcandrew Thomas H
Purchase Details
Closed on
Nov 21, 1995
Sold by
Bridgewater Inc
Bought by
Cornerstone Craftmen Inc
Create a Home Valuation Report for This Property
The Home Valuation Report is an in-depth analysis detailing your home's value as well as a comparison with similar homes in the area
Home Values in the Area
Average Home Value in this Area
Purchase History
| Date | Buyer | Sale Price | Title Company |
|---|---|---|---|
| Jackson Brian K | -- | -- | |
| Jackson Brian K | $342,900 | -- | |
| Mcandrew Cynthia L | -- | -- | |
| Mcandrew Cynthia L | -- | -- | |
| Mcandrew Thomas H | $282,300 | -- | |
| Cornerstone Craftmen Inc | $43,000 | -- |
Source: Public Records
Mortgage History
| Date | Status | Borrower | Loan Amount |
|---|---|---|---|
| Open | Jackson Brian K | $354,215 | |
| Closed | Cornerstone Craftmen Inc | $0 |
Source: Public Records
Tax History Compared to Growth
Tax History
| Year | Tax Paid | Tax Assessment Tax Assessment Total Assessment is a certain percentage of the fair market value that is determined by local assessors to be the total taxable value of land and additions on the property. | Land | Improvement |
|---|---|---|---|---|
| 2025 | $5,122 | $271,960 | $48,920 | $223,040 |
| 2023 | $5,239 | $185,600 | $34,960 | $150,640 |
| 2022 | $4,883 | $185,600 | $34,960 | $150,640 |
| 2021 | $4,855 | $192,520 | $38,600 | $153,920 |
| 2020 | $4,888 | $192,640 | $30,640 | $162,000 |
| 2019 | $611 | $189,280 | $30,120 | $159,160 |
| 2018 | $4,583 | $184,800 | $29,400 | $155,400 |
| 2017 | $4,824 | $159,560 | $31,320 | $128,240 |
| 2016 | $4,724 | $159,560 | $31,320 | $128,240 |
| 2015 | $4,775 | $159,560 | $31,320 | $128,240 |
| 2014 | $4,368 | $136,880 | $26,880 | $110,000 |
Source: Public Records
Map
Nearby Homes
- 3450 Merganser Ln
- 9675 Almaviva Dr
- 9715 Almaviva Dr
- 545 Oak Bridge Trail
- 515 Oak Bridge Trail
- 352 N Peak Dr
- 1210 Cromwell Ct
- 3235 Arborwoods Dr
- 150 Stoney Ridge Dr
- 595 Oak Alley Way
- 615 S Preston Ct
- 340 Mount Mitchell Way
- 3765 Redcoat Way
- 8870 Old Southwick Pass
- 2045 Northwick Pass Way
- 9245 Brumbelow Rd
- 235 Stoney Ridge Dr
- 1050 Bedford Gardens Dr
- 1055 Leadenhall St
- 3470 Merganser Ln
- 3450 Merganser Ln Unit 15
- 410 Stoney Ridge Ct Unit 3A
- 3440 Merganser Ln Unit 2
- 3480 Merganser Ln
- 420 Stoney Ridge Ct Unit IIIA
- 3425 Merganser Ln
- 3430 Merganser Ln
- 3435 Merganser Ln
- 3490 Merganser Ln
- 3445 Merganser Ln Unit 2
- 430 Stoney Ridge Ct Unit 111A
- 9500 Stoney Ridge Ln
- 9530 Stoney Ridge Ln
- 3420 Merganser Ln
- 3455 Merganser Ln
- 3415 Merganser Ln
- 3500 Merganser Ln Unit 2
- 9490 Stoney Ridge Ln Unit 3A
- 440 Stoney Ridge Ct