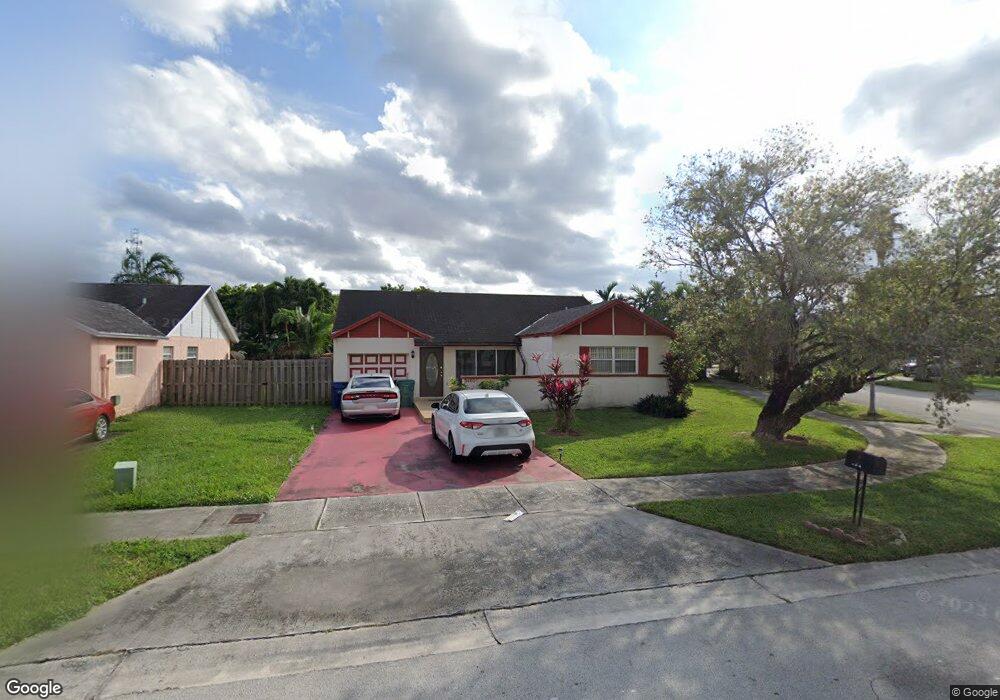
3460 NW 203rd Ln Miami Gardens, FL 33056
Carol City NeighborhoodEstimated Value: $462,159 - $518,000
3
Beds
2
Baths
1,358
Sq Ft
$365/Sq Ft
Est. Value
About This Home
This home is located at 3460 NW 203rd Ln, Miami Gardens, FL 33056 and is currently estimated at $495,290, approximately $364 per square foot. 3460 NW 203rd Ln is a home located in Miami-Dade County with nearby schools including Brentwood Elementary School, Carol City Middle School, and Miami Carol City Senior High School.
Ownership History
Date
Name
Owned For
Owner Type
Purchase Details
Closed on
Nov 7, 2012
Sold by
Frater Stephan
Bought by
Mov Holdings Llc
Current Estimated Value
Purchase Details
Closed on
Nov 6, 2012
Sold by
Collings Geneva Marcia
Bought by
Frater Stephan
Purchase Details
Closed on
Nov 3, 2006
Sold by
Collings Geneve Marcia and Goulbourne Linnette
Bought by
Collings Geneve Marcia
Purchase Details
Closed on
Oct 16, 2003
Sold by
Collings Geneve Marcia
Bought by
Collings Geneve Marcia and Goulbourne Linnette
Purchase Details
Closed on
Oct 7, 1996
Sold by
Sangster Peter W and Hylton Ann M
Bought by
Collings Geneve
Home Financials for this Owner
Home Financials are based on the most recent Mortgage that was taken out on this home.
Original Mortgage
$65,966
Interest Rate
7.87%
Mortgage Type
FHA
Create a Home Valuation Report for This Property
The Home Valuation Report is an in-depth analysis detailing your home's value as well as a comparison with similar homes in the area
Home Values in the Area
Average Home Value in this Area
Purchase History
| Date | Buyer | Sale Price | Title Company |
|---|---|---|---|
| Mov Holdings Llc | $85,000 | Attorney | |
| Frater Stephan | $75,000 | Red Door Title Services Inc | |
| Collings Geneve Marcia | -- | Surealty Title Inc | |
| Collings Geneve Marcia | -- | -- | |
| Collings Geneve | $66,000 | -- |
Source: Public Records
Mortgage History
| Date | Status | Borrower | Loan Amount |
|---|---|---|---|
| Previous Owner | Collings Geneve | $120,000 | |
| Previous Owner | Collings Geneve | $0 | |
| Previous Owner | Collings Geneve | $65,966 |
Source: Public Records
Tax History Compared to Growth
Tax History
| Year | Tax Paid | Tax Assessment Tax Assessment Total Assessment is a certain percentage of the fair market value that is determined by local assessors to be the total taxable value of land and additions on the property. | Land | Improvement |
|---|---|---|---|---|
| 2025 | $7,017 | $268,876 | -- | -- |
| 2024 | $6,207 | $244,433 | -- | -- |
| 2023 | $6,207 | $222,356 | $0 | $0 |
| 2022 | $5,565 | $202,142 | $0 | $0 |
| 2021 | $4,940 | $183,766 | $0 | $0 |
| 2020 | $4,681 | $188,114 | $76,017 | $112,097 |
| 2019 | $4,470 | $189,715 | $76,017 | $113,698 |
| 2018 | $3,967 | $169,552 | $54,254 | $115,298 |
| 2017 | $3,821 | $125,516 | $0 | $0 |
| 2016 | $3,351 | $114,106 | $0 | $0 |
| 2015 | $3,183 | $103,733 | $0 | $0 |
| 2014 | $2,922 | $94,303 | $0 | $0 |
Source: Public Records
Map
Nearby Homes
- 20314 NW 36th Ct
- 20327 NW 33rd Ave
- 3763 NW 204th St
- 20316 NW 32nd Path
- 3738 NW 207th Dr
- 20600 NW 34th Ave
- 20620 NW 34th Ave
- 19900 NW 37th Ave Unit A40
- 3521 NW 208th Terrace
- 3347 NW 198th Terrace
- 3125 NW 205th St
- 3130 NW 203rd Terrace
- 3800 NW 208th St
- 3120 NW 203rd Terrace
- 19754 NW 34th Ave
- 3110 NW 203rd Terrace
- 3060 NW 204th Ln
- 3382 NW 197th Terrace
- 3600 NW 210th Terrace
- 3834 NW 209th St
- 3450 NW 203rd Ln
- 20319 NW 35th Ave
- 3440 NW 203rd Ln
- 20315 NW 35th Ave
- 20316 NW 34th Ct
- 20340 NW 35th Ave
- 20330 NW 35th Ave
- 20351 NW 35th Ave
- 20324 NW 35th Ave
- 20350 NW 35th Ave
- 20320 NW 35th Ave
- 20344 NW 34th Ct
- 20309 NW 35th Ave
- 20371 NW 35th Ave
- 20308 NW 34th Ct
- 20316 NW 35th Ave
- 20370 NW 35th Ave
- 20363 NW 36th Ave
- 20353 NW 36th Ave