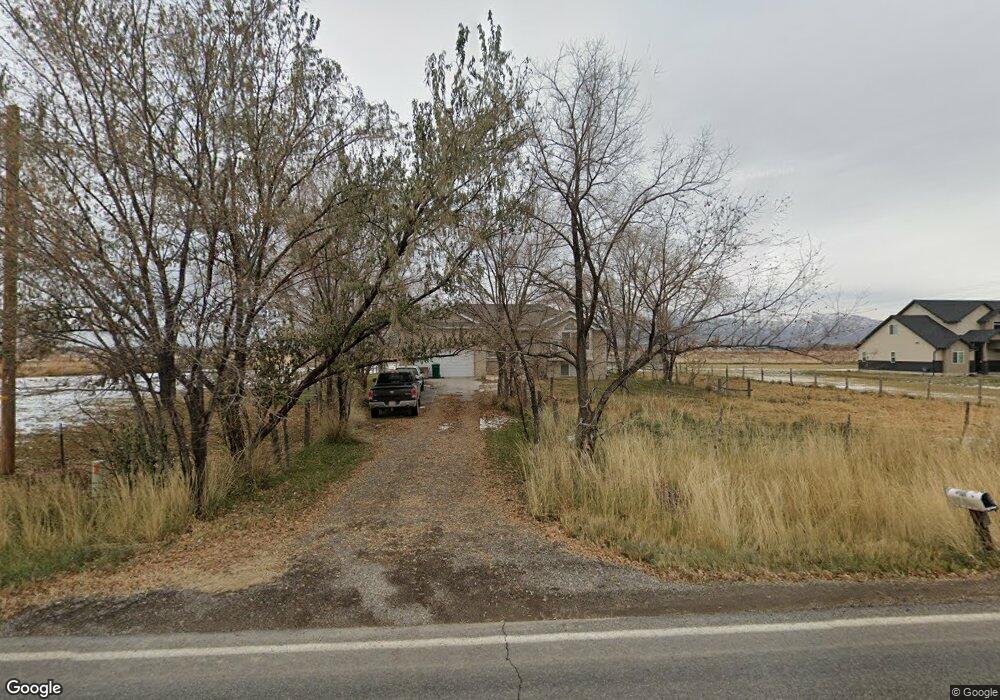
3460 W 3600 S West Haven, UT 84401
Estimated Value: $1,069,427
4
Beds
1
Bath
1,188
Sq Ft
$900/Sq Ft
Est. Value
About This Home
This home is located at 3460 W 3600 S, West Haven, UT 84401 and is currently priced at $1,069,427, approximately $900 per square foot. 3460 W 3600 S is a home located in Weber County with nearby schools including Kanesville Elementary School, Rocky Mountain Junior High School, and Fremont High School.
Ownership History
Date
Name
Owned For
Owner Type
Purchase Details
Closed on
Jan 29, 2021
Sold by
Westwood Michael D and Westwood Family Trust
Bought by
Rset Development Llc
Current Estimated Value
Purchase Details
Closed on
Jan 21, 2021
Sold by
Westwood Marilyn M
Bought by
Westwood Family Trust
Purchase Details
Closed on
Nov 3, 2020
Sold by
Westwood Marilyn M and Westwood Family Trust
Bought by
Westwood Marilyn M and Westwood Michael D
Purchase Details
Closed on
Feb 12, 2007
Sold by
Westwood Darrel and Westwood Marilyn M
Bought by
Westwood Darrel and Westwood Marilyn M
Create a Home Valuation Report for This Property
The Home Valuation Report is an in-depth analysis detailing your home's value as well as a comparison with similar homes in the area
Home Values in the Area
Average Home Value in this Area
Purchase History
| Date | Buyer | Sale Price | Title Company |
|---|---|---|---|
| Rset Development Llc | -- | Real Advantage Title Ins | |
| Westwood Family Trust | -- | -- | |
| Westwood Marilyn M | -- | None Available | |
| Westwood Darrel | -- | None Available |
Source: Public Records
Tax History Compared to Growth
Tax History
| Year | Tax Paid | Tax Assessment Tax Assessment Total Assessment is a certain percentage of the fair market value that is determined by local assessors to be the total taxable value of land and additions on the property. | Land | Improvement |
|---|---|---|---|---|
| 2023 | $27,126 | $1,730,000 | $1,649,403 | $80,597 |
| 2022 | $16,135 | $1,834,969 | $1,649,403 | $185,566 |
| 2021 | $86,404 | $1,844,996 | $1,554,400 | $290,596 |
| 2020 | $1,380 | $1,724,003 | $1,549,400 | $174,603 |
| 2019 | $1,307 | $1,690,001 | $1,549,400 | $140,601 |
| 2018 | $1,386 | $1,686,608 | $1,534,437 | $152,171 |
| 2017 | $1,282 | $1,283,784 | $1,164,550 | $119,234 |
| 2016 | $1,301 | $100,693 | $35,118 | $65,575 |
| 2015 | $1,132 | $86,510 | $34,938 | $51,572 |
| 2014 | $1,084 | $80,937 | $35,699 | $45,238 |
Source: Public Records
Map
Nearby Homes
- 3553 S 3150 West St Unit 104
- 3579 S 3150 West St Unit 102
- 4612 W 3725 S Unit 236
- 3589 S 3150 W Unit 101
- 3569 S 3150 W Unit 103
- 3327 W 3715 S
- 3324 W 3745 S
- 3367 W 3785 S
- 3329 W 3745 S
- 3327 W 3745 S Unit 4050
- 3321 W 3745 S
- 3724 S 3650 W
- 3604 S Macy Ln
- 3717 S 3250 W
- 3634 S Macy Ln
- 3155 W St Unit 168
- 3163 W 3450 S Unit 164
- 3942 S 3450 W
- 3165 W 3475 S Unit 167
- 3639 S Macy Ln