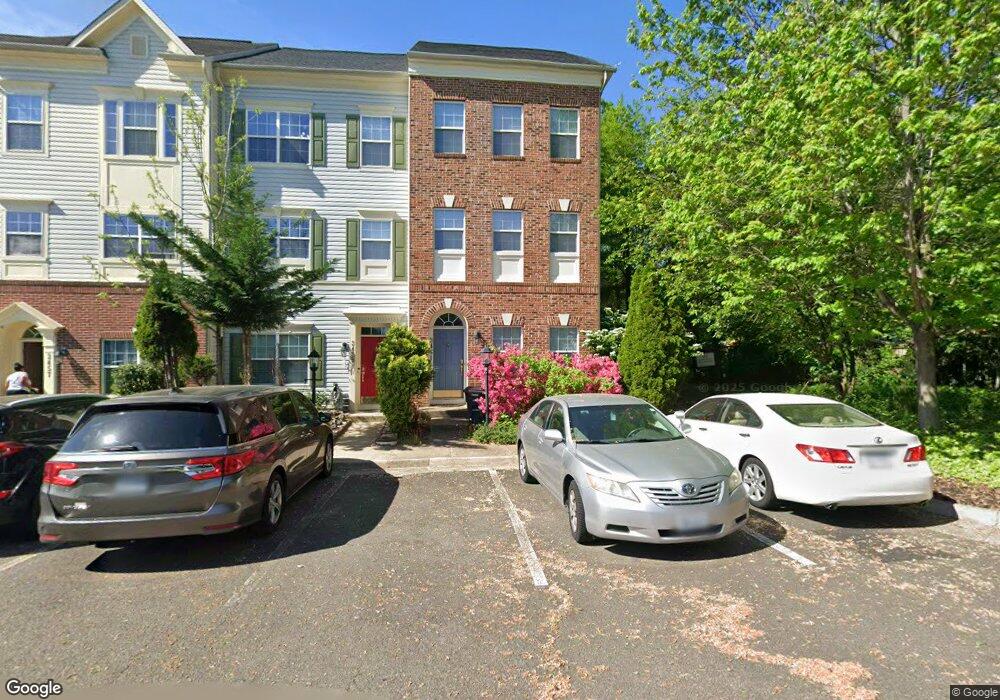
3461 Evergreen Farm Place Alexandria, VA 22306
Estimated Value: $448,000 - $574,078
3
Beds
3
Baths
1,296
Sq Ft
$399/Sq Ft
Est. Value
About This Home
This home is located at 3461 Evergreen Farm Place, Alexandria, VA 22306 and is currently estimated at $516,770, approximately $398 per square foot. 3461 Evergreen Farm Place is a home located in Fairfax County with nearby schools including Riverside Elementary School, Whitman Middle School, and Mount Vernon High.
Ownership History
Date
Name
Owned For
Owner Type
Purchase Details
Closed on
Sep 11, 2009
Sold by
Bank Of New York Mellon Tr
Bought by
Atoe Peter
Current Estimated Value
Home Financials for this Owner
Home Financials are based on the most recent Mortgage that was taken out on this home.
Original Mortgage
$234,000
Outstanding Balance
$153,965
Interest Rate
5.31%
Mortgage Type
New Conventional
Estimated Equity
$362,805
Purchase Details
Closed on
Jul 6, 2009
Sold by
White Samuel I
Bought by
The Bank Of New York Mellon
Purchase Details
Closed on
Dec 27, 2005
Sold by
Brookfield Ladson Lane Ll
Bought by
Salinas Harold
Home Financials for this Owner
Home Financials are based on the most recent Mortgage that was taken out on this home.
Original Mortgage
$435,872
Interest Rate
6.39%
Mortgage Type
New Conventional
Create a Home Valuation Report for This Property
The Home Valuation Report is an in-depth analysis detailing your home's value as well as a comparison with similar homes in the area
Home Values in the Area
Average Home Value in this Area
Purchase History
| Date | Buyer | Sale Price | Title Company |
|---|---|---|---|
| Atoe Peter | $260,000 | -- | |
| The Bank Of New York Mellon | $480,978 | -- | |
| Salinas Harold | $544,840 | -- |
Source: Public Records
Mortgage History
| Date | Status | Borrower | Loan Amount |
|---|---|---|---|
| Open | Atoe Peter | $234,000 | |
| Previous Owner | Salinas Harold | $435,872 |
Source: Public Records
Tax History Compared to Growth
Tax History
| Year | Tax Paid | Tax Assessment Tax Assessment Total Assessment is a certain percentage of the fair market value that is determined by local assessors to be the total taxable value of land and additions on the property. | Land | Improvement |
|---|---|---|---|---|
| 2025 | $5,482 | $502,310 | $195,000 | $307,310 |
| 2024 | $5,482 | $473,160 | $180,000 | $293,160 |
| 2023 | $5,461 | $483,880 | $180,000 | $303,880 |
| 2022 | $5,044 | $441,110 | $162,000 | $279,110 |
| 2021 | $4,827 | $411,350 | $135,000 | $276,350 |
| 2020 | $4,227 | $357,170 | $105,000 | $252,170 |
| 2019 | $4,210 | $355,710 | $105,000 | $250,710 |
| 2018 | $4,091 | $355,710 | $105,000 | $250,710 |
| 2017 | $4,130 | $355,710 | $105,000 | $250,710 |
| 2016 | $3,959 | $341,760 | $99,000 | $242,760 |
| 2015 | $3,255 | $291,690 | $86,000 | $205,690 |
| 2014 | $3,248 | $291,690 | $86,000 | $205,690 |
Source: Public Records
Map
Nearby Homes
- 8101 Richmond Hwy
- 7984 Audubon Ave Unit 203
- 3416 Sunny View Dr
- 2913 Dunbar St
- 3916 Woodhue Place Unit 8
- 2817 Derek Rd
- 8041 Pantano Place Unit 21
- 3827 El Camino Place Unit 13
- 7804 Gum Springs Village Dr
- 3878 Havenwood Place Unit 75D
- 3823 Monte Vista Place Unit 97D
- 3804 El Cerrito Place Unit 4E
- 3744 Shannons Green Way
- 7814 Belvedere Dr
- 7947 Sausalito Place Unit 25C
- 3775 Shannons Green Way
- 7803 Fordson Rd
- 3419 Ramsgate Terrace
- 8259 Cedar Landing Ct
- 8205 Cedar Landing Ct
- 3459 Evergreen Farm Place
- 3457 Evergreen Farm Place
- 3455 Evergreen Farm Place
- 3429 Ladson Ln
- 3453 Evergreen Farm Place
- 3451 Evergreen Farm Place
- 3431 Ladson Ln
- 7988 Avery Park Ct
- 7990 Avery Park Ct
- 7986 Avery Park Ct
- 7992 Avery Park Ct
- 7994 Avery Park Ct
- 7996 Avery Park Ct
- 7998 Avery Park Ct
- 7985 Avery Park Ct
- 7989 Avery Park Ct
- 7987 Avery Park Ct
- 7991 Avery Park Ct
- 7983 Avery Park Ct
- 7993 Avery Park Ct