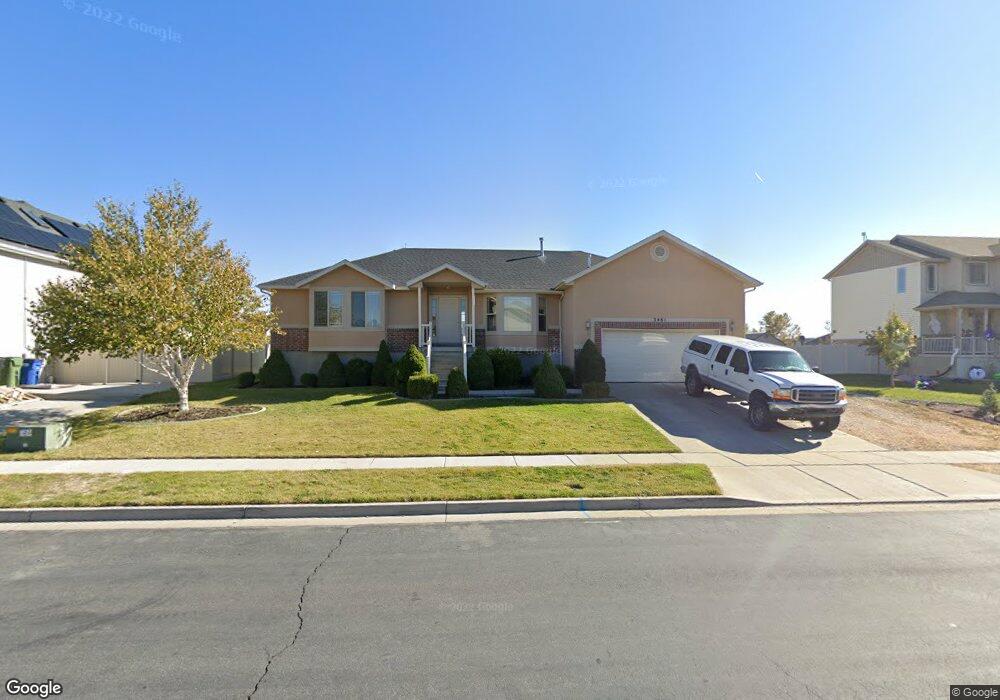
3461 Jupiter Hills Dr Syracuse, UT 84075
Estimated Value: $594,000 - $698,000
5
Beds
3
Baths
3,643
Sq Ft
$176/Sq Ft
Est. Value
About This Home
This home is located at 3461 Jupiter Hills Dr, Syracuse, UT 84075 and is currently estimated at $642,545, approximately $176 per square foot. 3461 Jupiter Hills Dr is a home located in Davis County with nearby schools including Buffalo Point School, Syracuse Junior High School, and Syracuse High School.
Ownership History
Date
Name
Owned For
Owner Type
Purchase Details
Closed on
Jun 6, 2006
Sold by
Scadden Tanner L
Bought by
Pickrell Monty R and Pickrell Heidi M
Current Estimated Value
Home Financials for this Owner
Home Financials are based on the most recent Mortgage that was taken out on this home.
Original Mortgage
$231,200
Outstanding Balance
$134,818
Interest Rate
6.52%
Mortgage Type
Fannie Mae Freddie Mac
Estimated Equity
$507,727
Purchase Details
Closed on
Aug 22, 2005
Sold by
Dennis Higley Inc
Bought by
Scadden Tanner L
Home Financials for this Owner
Home Financials are based on the most recent Mortgage that was taken out on this home.
Original Mortgage
$43,910
Interest Rate
5.22%
Mortgage Type
Stand Alone Second
Purchase Details
Closed on
Jul 14, 2004
Sold by
Blackburn Jones Real Estate Inc
Bought by
Dennis Higley Inc and Dhi Construction
Create a Home Valuation Report for This Property
The Home Valuation Report is an in-depth analysis detailing your home's value as well as a comparison with similar homes in the area
Home Values in the Area
Average Home Value in this Area
Purchase History
| Date | Buyer | Sale Price | Title Company |
|---|---|---|---|
| Pickrell Monty R | -- | First American Title | |
| Scadden Tanner L | -- | Equity Title Ins Agency Inc | |
| Dennis Higley Inc | -- | First American Title Co |
Source: Public Records
Mortgage History
| Date | Status | Borrower | Loan Amount |
|---|---|---|---|
| Open | Pickrell Monty R | $231,200 | |
| Closed | Pickrell Monty R | $57,800 | |
| Previous Owner | Scadden Tanner L | $43,910 | |
| Previous Owner | Scadden Tanner L | $175,640 |
Source: Public Records
Tax History Compared to Growth
Tax History
| Year | Tax Paid | Tax Assessment Tax Assessment Total Assessment is a certain percentage of the fair market value that is determined by local assessors to be the total taxable value of land and additions on the property. | Land | Improvement |
|---|---|---|---|---|
| 2025 | $2,953 | $284,900 | $108,430 | $176,470 |
| 2024 | $2,973 | $288,750 | $86,174 | $202,576 |
| 2023 | $2,899 | $282,150 | $72,328 | $209,821 |
| 2022 | $3,084 | $544,000 | $119,285 | $424,715 |
| 2021 | $2,723 | $409,000 | $95,684 | $313,316 |
| 2020 | $2,503 | $364,000 | $76,838 | $287,162 |
| 2019 | $2,466 | $354,000 | $80,854 | $273,146 |
| 2018 | $2,309 | $329,000 | $78,767 | $250,233 |
| 2016 | $2,092 | $156,310 | $33,098 | $123,212 |
| 2015 | $1,981 | $140,965 | $33,098 | $107,867 |
| 2014 | $1,824 | $132,308 | $33,098 | $99,210 |
| 2013 | -- | $135,862 | $33,302 | $102,560 |
Source: Public Records
Map
Nearby Homes
- 851 S 3525 W
- 3565 W 800 S
- 3627 W Augusta Dr
- 3649 W 800 S
- 895 Dunes Dr
- 3661 W 800 S
- 3736 W 1225 S
- 1441 Brookshire Dr
- 3564 Princeville Dr
- 3867 Rungsted Cir
- 3951 Baltimore Cir
- 3882 Turnberry Dr
- 2840 W 1200 S
- 1084 S 4090 W
- 835 S Criddle Rd
- 4105 W 550 S
- 1039 S 4250 W
- 4244 W 625 S
- 3579 W 1775 S
- 4191 W 1425 S
- 3471 Jupiter Hills Dr
- 3437 Jupiter Hills Dr
- 903 Jupiter Hills Cir
- 918 St Andrews Dr
- 3482 Jupiter Hills Dr
- 3417 Jupiter Hills Dr
- 902 Jupiter Hills Cir
- 936 Saint Andrews Dr
- 914 Jupiter Hills Cir
- 881 Jupiter Hills Cir
- 3502 Jupiter Hills Dr
- 3502 Jupiter Hills Dr Unit 4
- 3428 Jupiter Hills Dr
- 956 Saint Andrews Dr
- 886 Jupiter Hills Cir
- 878 Saint Andrews Dr
- 972 Saint Andrews Dr
- 3535 W 910 S
- 899 Saint Andrews Dr Unit 1010
- 863 Jupiter Hills Cir