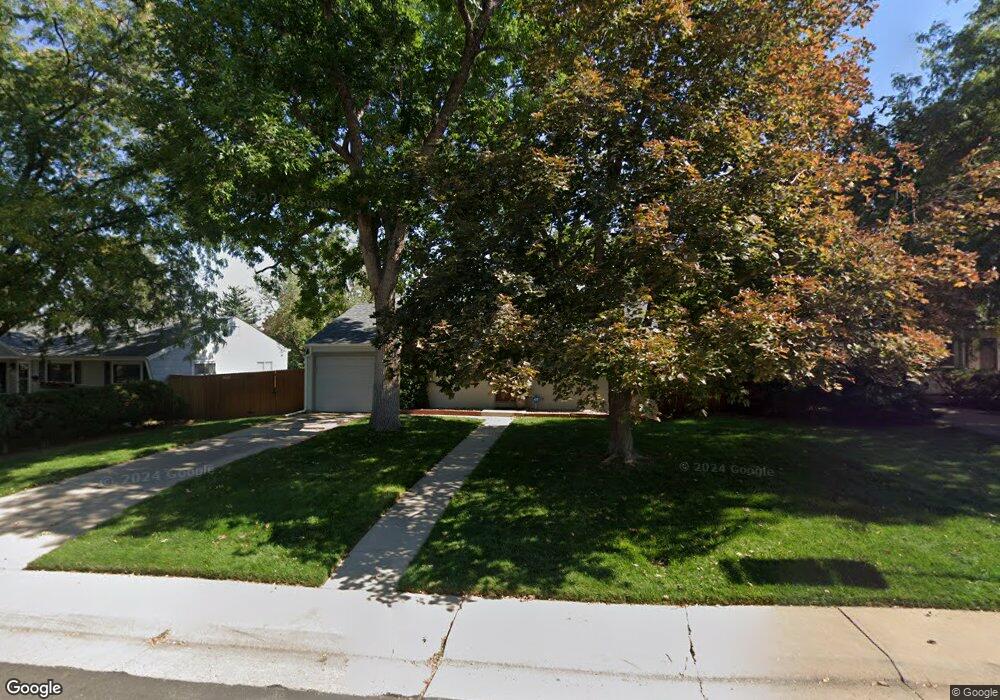
3462 S Grape St Denver, CO 80222
University Hills NeighborhoodEstimated Value: $435,913 - $494,000
2
Beds
1
Bath
849
Sq Ft
$534/Sq Ft
Est. Value
About This Home
This home is located at 3462 S Grape St, Denver, CO 80222 and is currently estimated at $453,728, approximately $534 per square foot. 3462 S Grape St is a home located in Denver County with nearby schools including Bradley Elementary School, Hamilton Middle School, and Thomas Jefferson High School.
Ownership History
Date
Name
Owned For
Owner Type
Purchase Details
Closed on
Jun 26, 2014
Sold by
Mcmillin Dana and Mcmillin Tate
Bought by
Wiehl Cheryl Ann
Current Estimated Value
Home Financials for this Owner
Home Financials are based on the most recent Mortgage that was taken out on this home.
Original Mortgage
$50,000
Outstanding Balance
$37,681
Interest Rate
4.19%
Mortgage Type
New Conventional
Estimated Equity
$416,047
Purchase Details
Closed on
Jun 30, 2011
Sold by
Woods Megan M
Bought by
Mcmillin Dana and Mcmillin Tate
Home Financials for this Owner
Home Financials are based on the most recent Mortgage that was taken out on this home.
Original Mortgage
$183,234
Interest Rate
4.25%
Mortgage Type
FHA
Purchase Details
Closed on
Aug 30, 2007
Sold by
Horst Cornelia Irene Vander
Bought by
Woods Megan M
Home Financials for this Owner
Home Financials are based on the most recent Mortgage that was taken out on this home.
Original Mortgage
$190,400
Interest Rate
6.66%
Mortgage Type
Purchase Money Mortgage
Create a Home Valuation Report for This Property
The Home Valuation Report is an in-depth analysis detailing your home's value as well as a comparison with similar homes in the area
Home Values in the Area
Average Home Value in this Area
Purchase History
| Date | Buyer | Sale Price | Title Company |
|---|---|---|---|
| Wiehl Cheryl Ann | $229,000 | Fidelity National Title Ins | |
| Mcmillin Dana | $188,000 | Land Title Guarantee Company | |
| Woods Megan M | $191,800 | Land Title Guarantee Company |
Source: Public Records
Mortgage History
| Date | Status | Borrower | Loan Amount |
|---|---|---|---|
| Open | Wiehl Cheryl Ann | $50,000 | |
| Previous Owner | Mcmillin Dana | $183,234 | |
| Previous Owner | Woods Megan M | $190,400 |
Source: Public Records
Tax History
| Year | Tax Paid | Tax Assessment Tax Assessment Total Assessment is a certain percentage of the fair market value that is determined by local assessors to be the total taxable value of land and additions on the property. | Land | Improvement |
|---|---|---|---|---|
| 2025 | $2,203 | $33,830 | $29,160 | $29,160 |
| 2024 | $2,203 | $27,820 | $19,770 | $8,050 |
| 2023 | $2,156 | $27,820 | $19,770 | $8,050 |
| 2022 | $2,092 | $26,300 | $18,790 | $7,510 |
| 2021 | $2,018 | $27,050 | $19,330 | $7,720 |
| 2020 | $1,697 | $22,870 | $18,200 | $4,670 |
| 2019 | $1,649 | $22,870 | $18,200 | $4,670 |
| 2018 | $1,636 | $21,140 | $16,030 | $5,110 |
| 2017 | $1,631 | $21,140 | $16,030 | $5,110 |
| 2016 | $1,503 | $18,430 | $15,196 | $3,234 |
| 2015 | $1,440 | $18,430 | $15,196 | $3,234 |
| 2014 | $1,219 | $14,680 | $7,602 | $7,078 |
Source: Public Records
Map
Nearby Homes
- 3445 S Holly St
- 3440 S Fairfax St
- 3506 S Holly St
- 3402 S Elm St
- 3601 S Grape St
- 3611 S Grape St
- 3461 S Ivy Way
- 3656 S Forest Way
- 3310 S Elm St
- 3227 S Grape St
- 5751 E Ithaca Place Unit 1
- 3532 S Hillcrest Dr Unit 4
- 3273 S Elm St
- 3243 S Fairfax St
- 3548 S Hillcrest Dr Unit 2
- 5832 E Ithaca Place Unit A
- 5300 Highline Place
- 3191 S Holly Place
- 4677 E Hampden Ave
- 3168 S Holly St
- 3474 S Grape St
- 3450 S Grape St
- 3479 S Hudson Way
- 3494 S Grape St
- 3438 S Grape St
- 3489 S Hudson Way
- 3469 S Grape St
- 3467 S Hudson Way
- 3495 S Hudson Way
- 3457 S Grape St
- 3479 S Grape St
- 3447 S Grape St
- 3426 S Grape St
- 3495 S Grape St
- 3457 S Hudson Way
- 3435 S Grape St
- 3414 S Grape St
- 3425 S Grape St
- 3450 S Glencoe St
- 3462 S Glencoe St
Your Personal Tour Guide
Ask me questions while you tour the home.