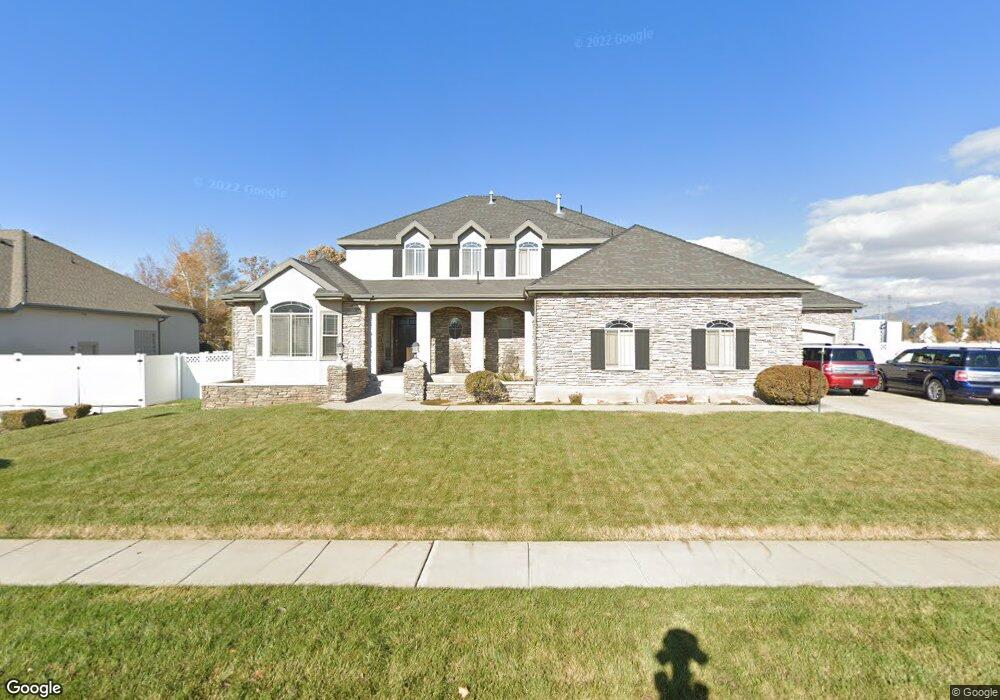
3462 W 850 N Layton, UT 84041
Estimated Value: $712,000 - $927,000
6
Beds
3
Baths
3,213
Sq Ft
$257/Sq Ft
Est. Value
About This Home
This home is located at 3462 W 850 N, Layton, UT 84041 and is currently estimated at $824,418, approximately $256 per square foot. 3462 W 850 N is a home located in Davis County with nearby schools including Sand Springs Elementary School, Legacy Junior High School, and Layton High School.
Ownership History
Date
Name
Owned For
Owner Type
Purchase Details
Closed on
May 24, 2006
Sold by
North Ivory
Bought by
Southerd Michael G and Southerd Katrina
Current Estimated Value
Home Financials for this Owner
Home Financials are based on the most recent Mortgage that was taken out on this home.
Original Mortgage
$315,496
Outstanding Balance
$183,348
Interest Rate
6.46%
Mortgage Type
VA
Estimated Equity
$641,070
Create a Home Valuation Report for This Property
The Home Valuation Report is an in-depth analysis detailing your home's value as well as a comparison with similar homes in the area
Home Values in the Area
Average Home Value in this Area
Purchase History
| Date | Buyer | Sale Price | Title Company |
|---|---|---|---|
| Southerd Michael G | -- | Cottonwood Title |
Source: Public Records
Mortgage History
| Date | Status | Borrower | Loan Amount |
|---|---|---|---|
| Open | Southerd Michael G | $315,496 |
Source: Public Records
Tax History Compared to Growth
Tax History
| Year | Tax Paid | Tax Assessment Tax Assessment Total Assessment is a certain percentage of the fair market value that is determined by local assessors to be the total taxable value of land and additions on the property. | Land | Improvement |
|---|---|---|---|---|
| 2025 | -- | $459,800 | $145,082 | $314,718 |
| 2024 | -- | $442,200 | $152,600 | $289,600 |
| 2023 | $1,563 | $759,000 | $167,202 | $591,798 |
| 2022 | $1,563 | $442,200 | $93,677 | $348,523 |
| 2021 | $502 | $577,000 | $140,467 | $436,533 |
| 2020 | $6 | $495,000 | $121,021 | $373,979 |
| 2019 | $2,973 | $480,000 | $117,179 | $362,821 |
| 2018 | $0 | $448,000 | $103,534 | $344,466 |
| 2016 | $557 | $218,185 | $44,303 | $173,882 |
| 2015 | $3,032 | $211,420 | $44,303 | $167,117 |
| 2014 | $102 | $180,999 | $44,303 | $136,696 |
| 2013 | -- | $194,279 | $40,209 | $154,070 |
Source: Public Records
Map
Nearby Homes