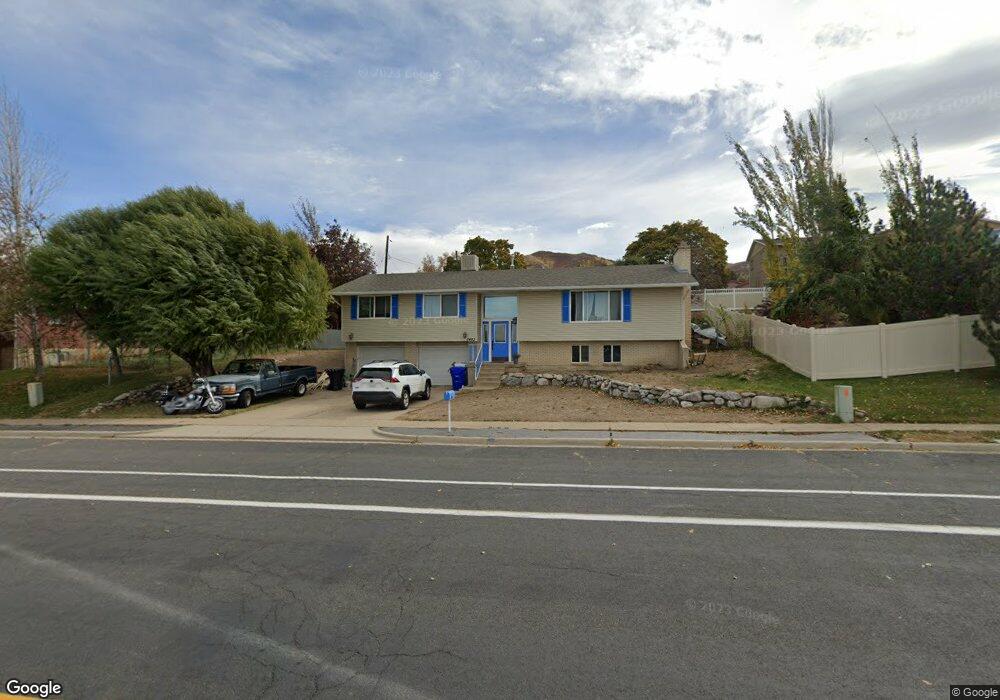
3463 S Davis Blvd Bountiful, UT 84010
Estimated Value: $572,000 - $612,000
4
Beds
3
Baths
2,324
Sq Ft
$254/Sq Ft
Est. Value
About This Home
This home is located at 3463 S Davis Blvd, Bountiful, UT 84010 and is currently estimated at $590,202, approximately $253 per square foot. 3463 S Davis Blvd is a home located in Davis County with nearby schools including Boulton School, South Davis Junior High School, and Woods Cross High School.
Ownership History
Date
Name
Owned For
Owner Type
Purchase Details
Closed on
Feb 23, 2011
Sold by
Lindsey Christine M
Bought by
Davis Zachary D
Current Estimated Value
Home Financials for this Owner
Home Financials are based on the most recent Mortgage that was taken out on this home.
Original Mortgage
$175,437
Outstanding Balance
$119,132
Interest Rate
4.62%
Mortgage Type
FHA
Estimated Equity
$471,070
Purchase Details
Closed on
Jun 24, 2005
Sold by
Lindsey Michael B
Bought by
Lindsey Michael B and Lindsey Christine M
Home Financials for this Owner
Home Financials are based on the most recent Mortgage that was taken out on this home.
Original Mortgage
$128,500
Interest Rate
5.65%
Mortgage Type
New Conventional
Purchase Details
Closed on
Jul 23, 1996
Sold by
Tibbs Shirley E
Bought by
Lindsey Michael and Lindsey Christine T
Create a Home Valuation Report for This Property
The Home Valuation Report is an in-depth analysis detailing your home's value as well as a comparison with similar homes in the area
Purchase History
| Date | Buyer | Sale Price | Title Company |
|---|---|---|---|
| Davis Zachary D | -- | Paramount Title Corp | |
| Lindsey Michael B | -- | Inwest Title Services Inc | |
| Lindsey Michael B | -- | Inwest Title Services Inc | |
| Lindsey Michael | -- | Old Republic Title Company |
Source: Public Records
Mortgage History
| Date | Status | Borrower | Loan Amount |
|---|---|---|---|
| Open | Davis Zachary D | $175,437 | |
| Previous Owner | Lindsey Michael B | $128,500 |
Source: Public Records
Tax History
| Year | Tax Paid | Tax Assessment Tax Assessment Total Assessment is a certain percentage of the fair market value that is determined by local assessors to be the total taxable value of land and additions on the property. | Land | Improvement |
|---|---|---|---|---|
| 2025 | $465 | $287,650 | $144,670 | $142,980 |
| 2024 | $372 | $276,650 | $133,212 | $143,438 |
| 2023 | $2,895 | $485,000 | $243,810 | $241,190 |
| 2022 | $2,951 | $277,200 | $130,144 | $147,056 |
| 2021 | $2,616 | $376,000 | $193,627 | $182,373 |
| 2020 | $2,311 | $333,000 | $145,014 | $187,986 |
| 2019 | $2,277 | $324,000 | $143,789 | $180,211 |
| 2018 | $2,107 | $295,000 | $140,741 | $154,259 |
| 2016 | $1,788 | $142,890 | $49,214 | $93,676 |
| 2015 | $1,732 | $130,900 | $49,214 | $81,686 |
| 2014 | $1,706 | $131,864 | $49,214 | $82,650 |
| 2013 | -- | $117,185 | $42,484 | $74,701 |
Source: Public Records
Map
Nearby Homes
- 3285 S Davis Blvd
- 8 E 3500 S
- 141 W 3100 S
- 336 W 3500 S
- 3716 S Oakridge Cir
- 1104 E Fairway Dr
- 468 W 3200 S
- 294 Springridge Dr
- 337 W 2900 S
- 527 Applewood Dr
- 3279 Plum Tree Ln
- 3241 Plum Tree Ln
- 3126 Applewood Dr
- 136 E Fairway Dr
- 3759 S Huntington Dr
- 438 Indian Springs Rd
- 2749 S 450 W
- 3893 S Bountiful Blvd
- 552 W 2900 S
- 53 N Foxhill Rd
- 3408 S 100 W
- 152 W 3500 S
- 152 Bona Vista Dr
- 138 Bona Vista Cir
- 3418 S 100 W
- 142 Bona Vista Cir
- 3428 S 100 W
- 3380 S Davis Blvd
- 134 Bona Vista Cir
- 3403 S 100 W
- 3378 S Davis Blvd
- 3438 S 100 W
- 171 W 3375 S
- 3334 S Davis Blvd
- 3413 S 100 W
- 161 Bona Vista Dr
- 3506 S Davis Blvd
- 162 W 3375 S
- 132 Bona Vista Dr
- 151 Bona Vista Dr
Your Personal Tour Guide
Ask me questions while you tour the home.