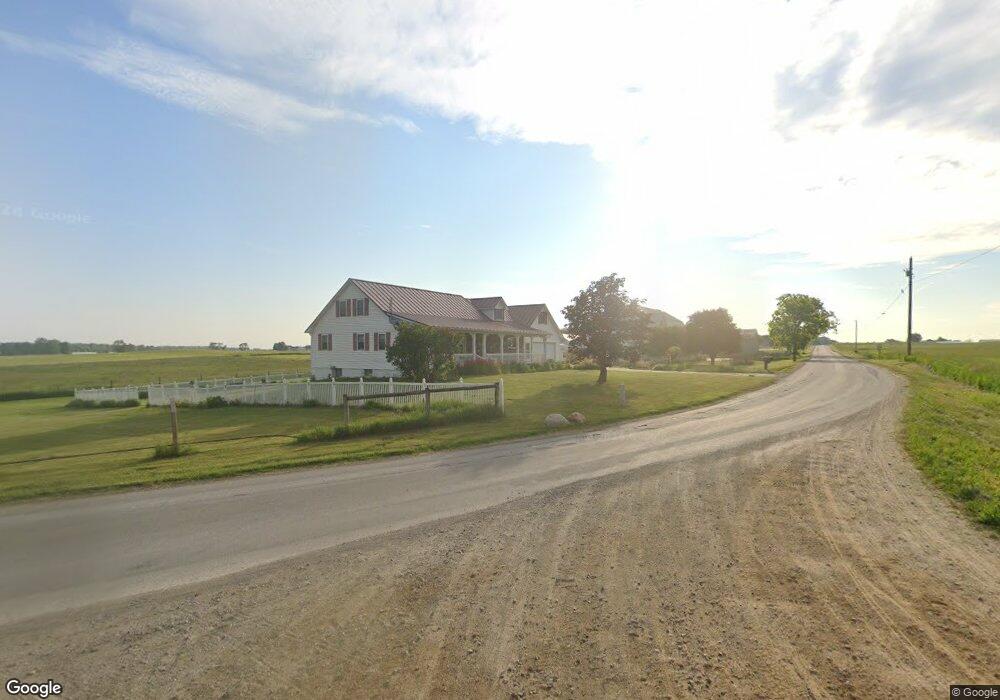
3465 W 050 N Lagrange, IN 46761
Estimated Value: $369,000 - $469,486
3
Beds
3
Baths
3,696
Sq Ft
$118/Sq Ft
Est. Value
About This Home
This home is located at 3465 W 050 N, Lagrange, IN 46761 and is currently estimated at $434,372, approximately $117 per square foot. 3465 W 050 N is a home located in LaGrange County with nearby schools including Meadowview Elementary School, Westview Elementary School, and Westview Junior/Senior High School.
Ownership History
Date
Name
Owned For
Owner Type
Purchase Details
Closed on
May 12, 2025
Sold by
Maurice D Hooley D and Maurice Ada A
Bought by
King Darin L
Current Estimated Value
Home Financials for this Owner
Home Financials are based on the most recent Mortgage that was taken out on this home.
Original Mortgage
$300,000
Outstanding Balance
$298,946
Interest Rate
6.69%
Mortgage Type
New Conventional
Estimated Equity
$135,426
Create a Home Valuation Report for This Property
The Home Valuation Report is an in-depth analysis detailing your home's value as well as a comparison with similar homes in the area
Home Values in the Area
Average Home Value in this Area
Purchase History
| Date | Buyer | Sale Price | Title Company |
|---|---|---|---|
| King Darin L | -- | None Listed On Document | |
| Maurice D Hooley And Ada A Beachy Hooley Join | $375,000 | None Listed On Document |
Source: Public Records
Mortgage History
| Date | Status | Borrower | Loan Amount |
|---|---|---|---|
| Open | King Darin L | $300,000 |
Source: Public Records
Tax History Compared to Growth
Tax History
| Year | Tax Paid | Tax Assessment Tax Assessment Total Assessment is a certain percentage of the fair market value that is determined by local assessors to be the total taxable value of land and additions on the property. | Land | Improvement |
|---|---|---|---|---|
| 2024 | $1,978 | $374,300 | $36,000 | $338,300 |
| 2023 | $1,914 | $373,800 | $39,000 | $334,800 |
| 2022 | $1,833 | $330,600 | $34,500 | $296,100 |
| 2021 | $1,638 | $284,000 | $31,200 | $252,800 |
| 2020 | $1,603 | $277,400 | $31,200 | $246,200 |
| 2019 | $1,575 | $274,100 | $31,200 | $242,900 |
| 2018 | $1,469 | $252,600 | $31,200 | $221,400 |
| 2017 | $1,501 | $260,400 | $30,200 | $230,200 |
| 2016 | $1,379 | $243,800 | $23,400 | $220,400 |
| 2014 | $984 | $172,900 | $23,400 | $149,500 |
| 2013 | $984 | $174,500 | $23,400 | $151,100 |
Source: Public Records
Map
Nearby Homes
- 1575 W 195 N
- 415 W 060 N
- 0 Corner of Factory St & Townline Rd Unit 202541800
- 217 N Sherman St
- 915 N 015 E
- 914 S Detroit St
- 207 S Poplar St
- 245 E 100 S
- 737 N Canal St
- 306 N 100 E
- 5145 N 290 W
- 7260 W 350 N
- 2930 N 080 E
- 365 Country Ln
- 7820 W 350 N
- 1895 W 570 N
- 1770 W 570 N
- 1400 N 200 E
- 125 E Lot 10
- 0 N 100 W