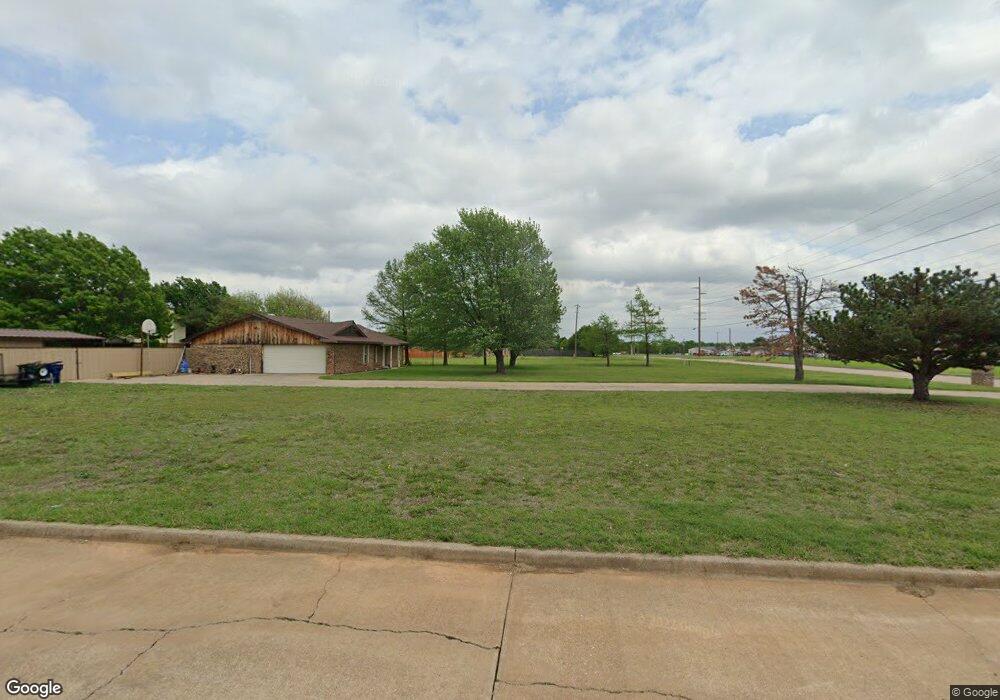
3465 W Bois d Arc Ave Duncan, OK 73533
Estimated Value: $176,000 - $219,000
3
Beds
2
Baths
1,775
Sq Ft
$113/Sq Ft
Est. Value
About This Home
This home is located at 3465 W Bois d Arc Ave, Duncan, OK 73533 and is currently estimated at $200,682, approximately $113 per square foot. 3465 W Bois d Arc Ave is a home located in Stephens County with nearby schools including Mark Twain Elementary School, Duncan Middle School, and Duncan High School.
Ownership History
Date
Name
Owned For
Owner Type
Purchase Details
Closed on
May 15, 2023
Sold by
Hale Chisholm L and Hale Jayla
Bought by
Miller James Denton and Miller Latisha Kay
Current Estimated Value
Home Financials for this Owner
Home Financials are based on the most recent Mortgage that was taken out on this home.
Original Mortgage
$176,739
Outstanding Balance
$171,570
Interest Rate
6.32%
Mortgage Type
FHA
Estimated Equity
$29,112
Purchase Details
Closed on
Jan 19, 2016
Sold by
Lowell William and Hale Audra Annette
Bought by
Hale Chisholm L
Home Financials for this Owner
Home Financials are based on the most recent Mortgage that was taken out on this home.
Original Mortgage
$80,000
Interest Rate
3.98%
Mortgage Type
New Conventional
Purchase Details
Closed on
Mar 25, 1993
Sold by
Smith Ben and Smith Loretta
Bought by
Hale William Lowell and Hale Audra A
Create a Home Valuation Report for This Property
The Home Valuation Report is an in-depth analysis detailing your home's value as well as a comparison with similar homes in the area
Home Values in the Area
Average Home Value in this Area
Purchase History
| Date | Buyer | Sale Price | Title Company |
|---|---|---|---|
| Miller James Denton | $180,000 | Old Republic Title | |
| Hale Chisholm L | $100,000 | None Available | |
| Hale William Lowell | $61,000 | -- |
Source: Public Records
Mortgage History
| Date | Status | Borrower | Loan Amount |
|---|---|---|---|
| Open | Miller James Denton | $176,739 | |
| Previous Owner | Hale Chisholm L | $80,000 |
Source: Public Records
Tax History Compared to Growth
Tax History
| Year | Tax Paid | Tax Assessment Tax Assessment Total Assessment is a certain percentage of the fair market value that is determined by local assessors to be the total taxable value of land and additions on the property. | Land | Improvement |
|---|---|---|---|---|
| 2025 | $1,520 | $19,016 | $1,317 | $17,699 |
| 2024 | $1,601 | $19,790 | $1,317 | $18,473 |
| 2023 | $1,601 | $14,120 | $1,317 | $12,803 |
| 2022 | $1,110 | $14,477 | $1,317 | $13,160 |
| 2021 | $1,042 | $13,239 | $1,317 | $11,922 |
| 2020 | $999 | $12,569 | $1,317 | $11,252 |
| 2019 | $934 | $11,795 | $1,317 | $10,478 |
| 2018 | $895 | $11,044 | $1,317 | $9,727 |
| 2017 | $911 | $11,603 | $1,317 | $10,286 |
| 2016 | $946 | $11,135 | $1,012 | $10,123 |
| 2015 | $776 | $10,205 | $880 | $9,325 |
| 2014 | $776 | $9,720 | $814 | $8,906 |
Source: Public Records
Map
Nearby Homes
- TBD S 27th St
- 1223 S 42nd St
- 1715 S 42nd St
- 210 N 31st St
- 106 Emery Rd
- 206 N 28th St
- 0 W Beech Ave
- 2110 W Main St
- 0000 W Beech Ave Unit A
- 0001 W Beech Ave Unit B
- 0002 W Beech Ave Unit C
- 201 N 23rd St
- 209 N 22nd St
- 1244 Carriage Dr
- 2086 N 44th St
- 701 Drexal Place
- 2011 W Oak Ave
- 2006 W Oak Ave
- 1385 Smith Rd
- 174831 N 2844 Rd
- 730 Westside Dr
- 726 Westside Dr
- 3505 W Bois d Arc Ave
- 721 Westside Dr
- 722 Westside Dr
- 717 Westside Dr
- 718 Westside Dr
- 3509 W Bois d Arc Ave
- 713 Westside Dr
- 860 Westside Dr
- 745 Westview Rd
- 710 Westside Dr
- 735 Westview Rd
- 709 Westside Dr
- 725 Westview Rd
- 706 Westside Dr
- 3605 W Bois d Arc Ave
- 705 Westside Dr
- ???? W Bois D'Arc Ave
- 2114 W Bois D'Arc Ave