Estimated Value: $222,044 - $252,000
3
Beds
2
Baths
1,274
Sq Ft
$189/Sq Ft
Est. Value
About This Home
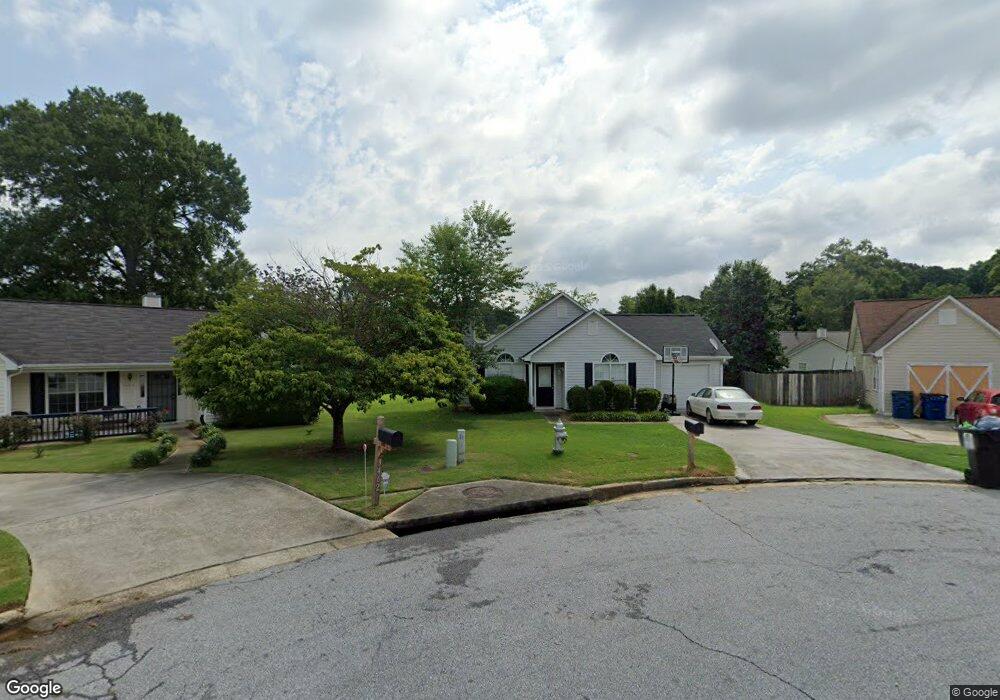
This home is located at 3466 Ashley Ct Unit 3, Rex, GA 30273 and is currently estimated at $241,261, approximately $189 per square foot. 3466 Ashley Ct Unit 3 is a home located in Clayton County with nearby schools including East Clayton Elementary School, Adamson Middle School, and Morrow High School.
Ownership History
Date
Name
Owned For
Owner Type
Purchase Details
Closed on
Jun 6, 2019
Sold by
Pmc Sfr Holding Llc
Bought by
Pmc Sfr Borrower Llc
Current Estimated Value
Purchase Details
Closed on
Jun 28, 2016
Sold by
Pretium Mtg Acquisitio Trust
Bought by
Pretium Sfr Holding Llc
Purchase Details
Closed on
Dec 1, 2015
Sold by
Owens Charlie L
Bought by
Wilmington Savings Fund Society Fsb Trus and Christian Trust
Purchase Details
Closed on
Aug 19, 2005
Sold by
Lesueur Deborah S
Bought by
Owens Charlie L and Owens Cardene
Home Financials for this Owner
Home Financials are based on the most recent Mortgage that was taken out on this home.
Original Mortgage
$117,800
Interest Rate
5.64%
Mortgage Type
VA
Purchase Details
Closed on
Mar 31, 1995
Sold by
Jones Communities
Bought by
Lesueur Deborah S
Create a Home Valuation Report for This Property
The Home Valuation Report is an in-depth analysis detailing your home's value as well as a comparison with similar homes in the area
Home Values in the Area
Average Home Value in this Area
Purchase History
| Date | Buyer | Sale Price | Title Company |
|---|---|---|---|
| Pmc Sfr Borrower Llc | -- | -- | |
| Pretium Sfr Holding Llc | $61,899 | -- | |
| Wilmington Savings Fund Society Fsb Trus | -- | -- | |
| Owens Charlie L | $118,800 | -- | |
| Lesueur Deborah S | $71,600 | -- |
Source: Public Records
Mortgage History
| Date | Status | Borrower | Loan Amount |
|---|---|---|---|
| Previous Owner | Owens Charlie L | $117,800 | |
| Closed | Lesueur Deborah S | $0 |
Source: Public Records
Tax History
| Year | Tax Paid | Tax Assessment Tax Assessment Total Assessment is a certain percentage of the fair market value that is determined by local assessors to be the total taxable value of land and additions on the property. | Land | Improvement |
|---|---|---|---|---|
| 2025 | $3,341 | $86,253 | $7,763 | $78,490 |
| 2024 | $2,987 | $88,920 | $8,000 | $80,920 |
| 2023 | $2,928 | $80,040 | $8,000 | $72,040 |
| 2022 | $2,636 | $66,200 | $8,000 | $58,200 |
| 2021 | $1,507 | $37,200 | $6,400 | $30,800 |
| 2020 | $1,526 | $37,200 | $6,400 | $30,800 |
| 2019 | $1,548 | $40,036 | $6,400 | $33,636 |
| 2018 | $1,378 | $33,004 | $6,400 | $26,604 |
| 2017 | $1,046 | $24,760 | $6,400 | $18,360 |
| 2016 | $1,046 | $24,760 | $6,400 | $18,360 |
| 2015 | $629 | $0 | $0 | $0 |
| 2014 | $498 | $21,545 | $6,400 | $15,145 |
Source: Public Records
Map
Nearby Homes
- 5798 Creekside Dr Unit 4
- 5806 Waggoner Ct
- 3548 Meadowview Ct
- 5781 Creekside Dr
- 5953 Farmbrook Ln Unit 1
- 5914 Waggoner Ct
- 5861 Colonnade Dr
- 3668 Paddington Trail
- 3684 Paddington Trail
- 5954 Rex Ridge Ct
- 5678 Washakie Point
- 5602 Swanson Rd
- 3645 Fay Dr Unit 1
- 3836 Rex Cir
- 5502 Amelia Ln
- 5652 Laney Dr
- 5847 Pinetree Ln
- 5640 Laney Dr
- 3777 Teton Pass
- 6010 Crooked Creek Dr
- 3466 Ashley Ct
- 3462 Ashley Ct Unit 3
- 3465 Ashley Ct Unit 3
- 5885 Creekside Dr Unit 4
- 5879 Creekside Dr
- 5891 Creekside Dr Unit 4
- 3463 Brook Ct Unit 3
- 5873 Creekside Dr
- 3458 Ashley Ct
- 3461 Ashley Ct
- 3467 Brook Ct
- 5897 Creekside Dr
- 5867 Creekside Dr
- 3459 Brook Ct
- 3457 Ashley Ct Unit 3
- 5880 Green Meadow Way
- 5874 Green Meadow Way Unit 3
- 5882 Creekside Dr Unit 4
- 3468 Heartland Dr
- 5892 Green Meadow Way
Your Personal Tour Guide
Ask me questions while you tour the home.