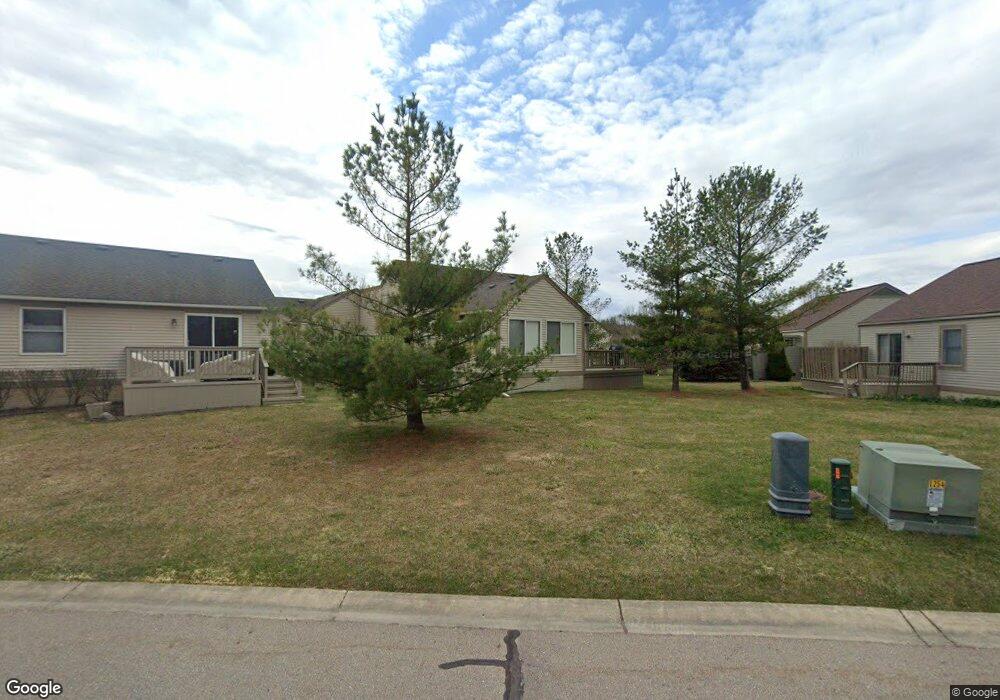
3467 Pinewood Ct Unit 60 Davison, MI 48423
Estimated Value: $227,785 - $242,000
2
Beds
2
Baths
1,221
Sq Ft
$194/Sq Ft
Est. Value
About This Home
This home is located at 3467 Pinewood Ct Unit 60, Davison, MI 48423 and is currently estimated at $236,946, approximately $194 per square foot. 3467 Pinewood Ct Unit 60 is a home located in Genesee County with nearby schools including Thomson Elementary School, Siple Elementary School, and Hill Elementary School.
Ownership History
Date
Name
Owned For
Owner Type
Purchase Details
Closed on
Sep 12, 2019
Sold by
Jones Jeanine L
Bought by
Garnett Jack L and Garnett Patricia A
Current Estimated Value
Home Financials for this Owner
Home Financials are based on the most recent Mortgage that was taken out on this home.
Original Mortgage
$150,000
Outstanding Balance
$131,388
Interest Rate
3.6%
Mortgage Type
Commercial
Estimated Equity
$105,558
Purchase Details
Closed on
Dec 8, 2016
Sold by
Becker Margaret
Bought by
Becker Family Trust
Purchase Details
Closed on
Jun 29, 2015
Sold by
Webb Jack C
Bought by
Becker Margaret E
Purchase Details
Closed on
Oct 21, 2008
Sold by
Webb Jack C
Bought by
Webb Jack C and Jack C Webb Trust
Purchase Details
Closed on
Sep 11, 2001
Sold by
Ward Deborah
Bought by
Webb Jack C
Purchase Details
Closed on
Feb 11, 1999
Sold by
The April 23Rd Corp
Bought by
Laski Alphonse and Laski Virginia
Create a Home Valuation Report for This Property
The Home Valuation Report is an in-depth analysis detailing your home's value as well as a comparison with similar homes in the area
Home Values in the Area
Average Home Value in this Area
Purchase History
| Date | Buyer | Sale Price | Title Company |
|---|---|---|---|
| Garnett Jack L | $148,000 | None Available | |
| Becker Family Trust | -- | None Available | |
| Becker Margaret E | $127,900 | Sargents Title Company | |
| Webb Jack C | -- | None Available | |
| Webb Jack C | $135,000 | Lawyers Title Ins | |
| Laski Alphonse A | -- | -- | |
| Laski Alphonse | $133,590 | Lawyers Title Insurance Corp |
Source: Public Records
Mortgage History
| Date | Status | Borrower | Loan Amount |
|---|---|---|---|
| Open | Garnett Jack L | $150,000 |
Source: Public Records
Tax History Compared to Growth
Tax History
| Year | Tax Paid | Tax Assessment Tax Assessment Total Assessment is a certain percentage of the fair market value that is determined by local assessors to be the total taxable value of land and additions on the property. | Land | Improvement |
|---|---|---|---|---|
| 2025 | $3,123 | $95,100 | $0 | $0 |
| 2024 | $940 | $92,100 | $0 | $0 |
| 2023 | $896 | $86,500 | $0 | $0 |
| 2022 | $2,874 | $74,200 | $0 | $0 |
| 2021 | $2,885 | $76,600 | $0 | $0 |
| 2020 | $855 | $73,900 | $0 | $0 |
| 2019 | $735 | $69,600 | $0 | $0 |
| 2018 | $1,456 | $64,700 | $0 | $0 |
| 2017 | $2,085 | $64,700 | $0 | $0 |
| 2016 | $2,060 | $60,000 | $0 | $0 |
| 2015 | $1,354 | $55,700 | $0 | $0 |
| 2014 | $522 | $45,400 | $0 | $0 |
| 2012 | -- | $45,300 | $45,300 | $0 |
Source: Public Records
Map
Nearby Homes
- 3365 Spruceridge Ct Unit 78
- 3372 Spruceridge Ct Unit 82
- 3369 Meadow Ridge Ct
- 3367 Meadow Ridge Ct
- 9413 Blue Spruce Ct Unit 54
- 9100 Dublin Way
- 9805 E Richfield Rd
- 4078 N State Rd
- 4063 N Gale Rd
- 3371 Meadowridge Ct Unit 107
- 9508 Orchard Lake Dr
- 9520 Orchard Lake Dr
- 255 Roosevelt Dr
- 10190 Hunt Dr
- 9440 E Potter Rd
- 0 N State Rd Unit 20250007293
- 7040 N Oak Rd
- 2351 Baltimore
- 2239 Baltimore Ln
- 7120 N Oak Rd
- 3467 Pinewood Ct Unit 42
- 3465 Pinewood Ct
- 3468 Pinewood Ct Unit 40
- 3463 Pinewood Ct Unit 44
- 3466 Pinewood Ct Unit 39
- 3464 Pinewood Ct Unit 38
- 3461 Pinewood Ct Unit 45
- 3462 Pinewood Ct Unit 37
- 3460 Pinewood Ct Unit 36
- 3458 Pinewood Ct Unit 35
- 9254 E Richfield Rd
- 9331 Pinecrest Ct
- 3457 Pinewood Ct Unit 47
- 9333 Pinecrest Ct Unit 9
- 3455 Pinewood Ct
- 3439 Pinemeadow Ct
- 9332 Pinecrest Ct Unit 18
- 9332 Pinecrest Ct Unit 28
- 3437 Pinemeadow Ct
- 3437 Pinemeadow Ct Unit 69